Siegfried Linkwitz
Audio Artistry Inc., Corte Madera, CA 94925, USA
May 1998
(Presented at the AES 105th Convention, 1998 September 26-29, San Francisco,
California, #4786)
ABSTRACT
In acoustically small rooms the naturalness of low frequency reproduction may
differ between dipolar and monopolar radiating woofers. The coupling of the two
types of sources to the modal structure of the room is investigated using
steady-state frequency response, cumulative spectral decay, energy-time curve,
modulation transfer function and tone burst response. When sets of shaped tone
bursts are used for measurement and listening, both frequency and time domain
attributes are brought to light which point to the perceived differences.
0 INTRODUCTION
Listening to two channel stereo or 5.1 channel home theater sound under
domestic conditions usually takes place in rooms that are acoustically small
over part of the audio spectrum. At low frequencies where the wavelength of
sound is as long, even a fairly large room with a floor plan of 7.63 m by 4.88 m
(25 ft by 16 ft) and a 2.75 m (9 ft) height is small when compared to a 20 Hz
wavelength of 17.2 m (56 ft). Above 200 Hz and 1.72 m (5.6 ft) wavelength,
though, most domestic rooms enter a wavelength region where they must be
considered acoustically large. The bass frequency range from 15 Hz to 150 Hz,
thus, covers a unique chapter in room acoustics: from the region where no
standing waves can exist, to the first few room resonances, to ever increasing
numbers of modes towards higher frequencies. It is not surprising then, that
bass reproduction varies widely between rooms of different sizes, proportions
and construction.
A number of listeners have observed that the quality of bass is different
whether reproduced by a monopolar, i.e. omnidirectional woofer, or a dipolar,
i.e. directional, figure-of-eight radiating woofer. The bass "boom"
often heard with an omnidirectional source is less pronounced with a directional
one. Furthermore, low frequency sonic detail can be presented with greater
resolution and life likeness from a dipolar woofer. While the "boom"
may enhance the impact of movie sound effects in some instances, it is
undesirable for accurate reproduction of musical instruments and voices. It must
be acknowledged, though, that upon first exposure to bass from a dipole woofer
some listeners prefer the generic loudspeaker bass, possibly because their
primary sonic reference is amplified sound and other box speakers. However,
after a period of acclimatization the preference changes when accompanied by
attention and reference to acoustic instrument sounds and voices.
The different behavior of monopole and dipole sources in a room has been
recognized and investigated previously [1, 2, 3]. This study is an attempt to
carry that work further and to find objective measures that explain the
subjectively observed differences. The work is focused on low frequency
reproduction only. At higher frequencies where a room is acoustically large, the
primary benefits of a dipolar source with well behaved polar response are: a
smooth off-axis frequency response, a lower level of the reverberant sound
field, a spectral balance of the reverberant sound field equivalent to that of
the on-axis sound pressure and the absence of box coloration due to an open
baffle design [3]. All of this results in a sound that is more open and life
like and less influenced by speaker placement and the room. The benefits of a
dipolar source for low frequencies are not as obvious.
1 MATHEMATICAL DESCRIPTION OF ROOMS
1.1 Rectangular rooms
The steady-state sound pressure distribution in a closed, rectangular rigid
room may be thought of as being formed by the total of standing waves or room
modes that fit the boundary condition, namely that the normal component of the
particle velocity must vanish at the surface of the walls. The eigenfrequencies
for which this occurs can be calculated [4, p. 53] from
f = ( c / 2 ) [ ( l / L )2 + ( w / W )2 + ( h / H )2
]1/2 [Hz] (1)
If the largest room dimension is the length L and l = 1, w = h = 0, then the
lowest frequency is
fmin = c / 2 L [Hz] (2)
In the above example room with L = 7.63 m (25 ft) and c = 344 m/s, the lowest
frequency is fmin = 22.6 Hz. Below this frequency the sound pressure
is no longer a function of location in the room. Its absolute level is
determined by the absorption characteristics of the six boundary surfaces and
the materials in the room.
At 22.5 Hz, the 7.63 m (25 ft) room length corresponds to a half wavelength
of sound. The sound particle velocity is zero at all times on the surfaces of
the front and rear walls. The sound pressure on each surface varies at the 22.5
Hz rate as the sound wave travels back and forth between them. This is a
resonance condition that can be described by a second order system with a
resonance curve of width BW [Hz] at the half power or -3 dB points. When the
excitation is removed, the sound pressure will decay by 60 dB in a time
T60 = 2.2 / BW [s] (3)
If the excitation is applied as a step function, then the sound pressure will
rise from 10% to 90% of the steady-state level during a time
Trise = 0.7 / BW = 0.32 T60 [s] (4)
Equations (1) through (4) will be useful in interpreting measured room
transfer functions later on. The eigenfrequencies from equation (1) are readily
tabulated in a spread sheet (Fig. 1) for various permutations of l, w and
h.

The spacing of eigenfrequencies is initially irregular and wide but decreases
rapidly as frequency increases. The number of eigenfrequencies between zero and
a given upper frequency limit fm can be estimated [4, p.56] from
N = (4
T60) )1/2 [m] (9)
where the directionality gain G is unity for a monopole and G = 3 for a
dipole [5]. A dipole, thus, has a 31/2 = 1.73 times larger
reverberation distance. Correspondingly, for a dipole the ratio of direct to
reverberant sound pressure level is 4.8 dB greater than for a monopole. A
typical reverberation distance is quite small, 0.68 m for the monopole and 1.18
m for the dipole in the example room. Thus, at 3 m distance from the source, the
direct sound would be 12.9 dB below the reverberant sound field for the monopole
and 8.1 dB for the dipole. The 4.8 dB lower level of the reverberant field in
the case of the dipole is significant by subjectively reducing the masking
influence of the room upon sonic detail, by avoiding the sensation of overload
of the room during loud passages of program material and by being much less
noisy to neighbors. Even at reduced level the spectral balance of the
reverberant field is important for naturalness of sound reproduction [3].
Several investigators have studied the distribution of eigenfrequencies in
order to arrive at optimum room dimensions. In the range below fs the
separation between eigenfrequencies may vary considerably. Fig. 2 shows this for
the example room.

Bonello [6] counts the number D of eigenfrequencies in each one-third octave
band between 10 Hz and 200 Hz and proposes criteria for the allowed variation of
D with frequency. Walker [7] squares the frequency difference between each pair
of eigenfrequencies, takes their sum and divides it by the number of
eigenfrequencies included. This procedure gives greater weight to undesired
widely spaced pairs in the resulting room quality index. The index was
calculated for rooms of different sizes and proportions. A room is deemed
acceptable if it meets the inequalities
1.1 ( W / H) < ( L / H) < 4.5 ( W / H ) - 4 (10)
The example room meets this criterion with 2.0 < 2.8 <
4.0.
In these investigations, though, no consideration is given to source type,
source position and listener position in the room. Modes at all eigenfrequencies
are assumed to be of equal strength. Yet, a monopolar pressure transducer will
primarily excite those modes for which it is located near a pressure maximum.
Only if placed in a room corner will it excite the maximum number of modes. A
dipolar radiator, which is a velocity transducer, will excite modes when placed
near their particle velocity maximum. In a rectangular room, though, there
exists no location which is a velocity maximum for all modes, equivalent to the
pressure maximum in a room corner. A dipole, being directional, will always
excite fewer than the total number of possible modes.
1.2 Room transfer function model
The purpose for reviewing the modal behavior of the room is to gain insight
into how a room of given size and proportions will affect the sound transmission
from woofer to listener [8, 9]. It is assumed that the steady-state room
transfer function contains information that explains the differences between
monopolar and dipolar radiation.
A greatly simplified model will be used for the room. By restricting the
analysis to the length dependent eigenfrequencies we only deal with reflections
from the front and rear wall. In equation (1) the coefficients w and h are zero.
For the 7.63 m (25 ft) long example room all eigenfrequencies are then multiples
of 22.6 Hz. The woofer is placed at 1.27 m (4.2 ft) from the front wall and the
listener at 4.29 m (14.1 ft). These locations are chosen as somewhat typical for
a loudspeaker setup and place the woofer in the pressure null of the 3-0-0 mode
and the listener in the null of the 8-0-0 mode (Fig. 3).

The analysis is carried out using a lossless transmission line model to
describe the acoustic path (Fig. 4). An assumed wall absorption coefficient of
17% is realized by terminating the lines with a 83% reflecting load.

Two steady-state transfer functions are shown in each of the following
figures. The first is the response with the wall behind the listener removed to
indicate the effect of the front wall reflection. The second response includes
both front and rear wall. Comparing the two curves points out the marginal
usefulness of an analysis that only considers the wall behind the speaker. The
same can be concluded about a speaker placement analysis for two intersecting
walls only or for a corner [10] that ignores the other walls. The opposite wall
always produces a strong influence on the overall response unless it is highly
absorptive, which is very difficult to achieve at low frequencies.
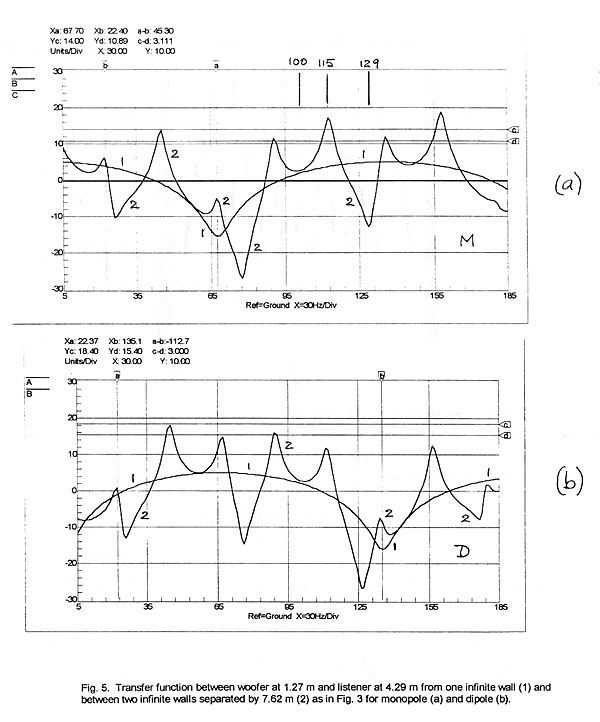
The steady-state transfer functions in Fig. 5a are for the monopole, those in
Fig. 5b for the dipole. The responses are quite different for the two types of
radiators, although it is difficult to conclude that either is superior. The dip
due to the front wall reflection occurs for the dipole at twice the frequency of
the monopole’s dip. The monopole is situated at the pressure minimum of the
67.7 Hz 3-0-0 mode (Fig. 3) and the response has, indeed, a depression at this
frequency but it also coincides with the dip from the front wall reflection. The
dipole has a peak at 67.7 Hz by being at the velocity maximum, but this peak is
still lower in amplitude than the one at 45.1 Hz for the 2-0-0 mode, even though
the dipole is not at a velocity maximum location for that mode. The preceding
shows that peaks in the response curve match the eigenfrequencies, but their
relative amplitudes are not easy to predict. The -3 dB bandwidth of the
resonances is constant at 3 Hz, corresponding to a 700 ms decay time for 17%
absorption (Equ. 3, 7).
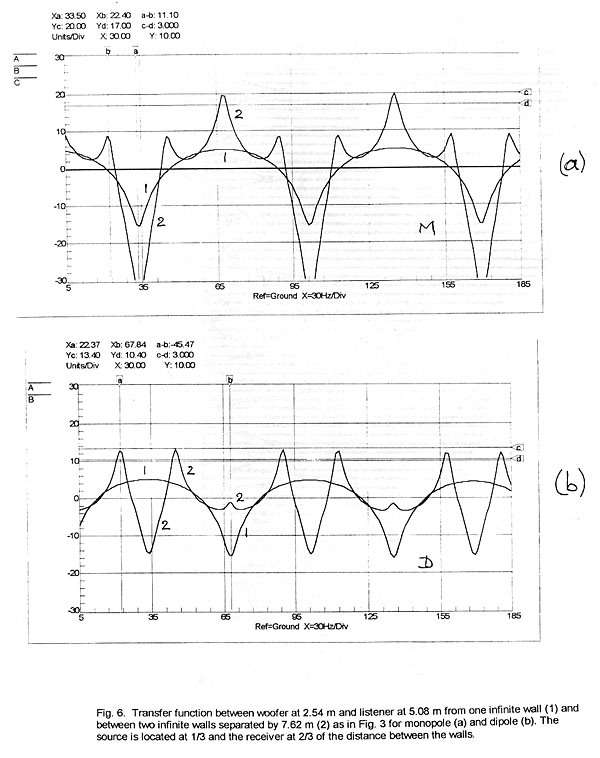
The same analysis is carried out with the room length divided into thirds
(Fig. 6). This type of setup is frequently talked about in audiophile circles.
It is not apparent why the resulting response should be an improvement over the
one in Fig. 5, nor that it has particular benefits for monopolar radiators for
which it is recommended.
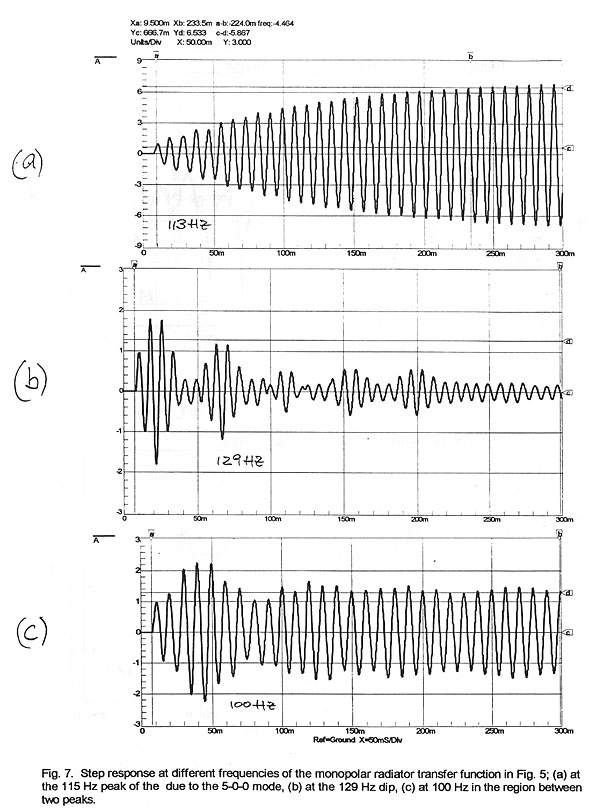
When we look at the response in the time domain by applying a 113 Hz signal
to excite the 5-0-0 mode (Fig. 5), we see that it takes 224 ms (Fig. 7) to reach
90% of steady-state, as was calculated from Equ. 4. At 129 Hz where the
steady-state frequency response dips we observe an oscillatory behavior of a low
amplitude time waveform, and at 100 Hz, between two resonance peaks, the
response builds up quickly but with overshoot and ringing.
As simple and incomplete as this model is for the analysis of the room
transfer function, it still points out the complexity of the response in both
time and frequency domains. It does not seem possible, though, to draw
conclusions about qualitative differences between omnidirectional and
directional woofers using this method alone since the model examines propagation
only along one axis. Different techniques will have to be used to obtain a more
complete picture.
1.3 Other room response analysis methods
A loudspeaker in a room can be modeled with image sources to describe the
multiple reflections from the six boundary surfaces. This method allows us to
take directivity into account as well as wall absorption. Both steady-state and
impulse response can be calculated but the method is computationally intensive.
Ray tracing techniques which are often used to investigate large spaces are
not appropriate for this case because they are based on the assumption that the
wavelengths of sound considered are vanishingly small compared to the room
dimensions and wall surfaces.
Finite element methods, FEM, can give a solution for the steady-state sound
pressure at any location in the room, but only one frequency at a time. Time
domain based step wise solutions to the propagation of sound from the speaker
provide a complete description of the sound field in time and frequency, but
require large amounts of computation.
All techniques are limited when trying to model real rooms with irregular
shapes, windows, openings and furniture of varying absorption and diffusion
properties. Yet, this is the usual environment for listening to stereo and home
theater.
2 TEST METHODS AND MEASUREMENTS
2.1 Test Source
A special woofer was constructed to allow immediate selection of either
omnidirectional or dipolar radiation without having to move any equipment. The
woofer contains two 300 mm (12 inch) drivers at each end of a 0.36 m x 0.36 m x
0.53 m (14 in x 14 in x 21 in) rectangular box. The two drivers operate in-phase
for monopolar and out-of-phase for dipolar radiation. The free field response is
equalized in each configuration to be flat over the frequency range of interest.
2.2 Steady-state transfer function
The steady-state response at the listening position for a radiator in a room
may be measured with a sine wave sweep or calculated from the measured impulse
response. The frequency sweep must be sufficiently slow for the room response to
reach steady-state behavior. Each resonance in the response must be traversed
much slower than the rise time for that resonance. With a sweep rate SR in Hz/s
and Equ. (4) we can write
BW / SR > 0.7 / BW
SR < 1.4 BW2 [Hz/s] (11)
For BW = 3.1 Hz the sweep rate must be less than 13.5 Hz/s. It would require
over 7.4 s to sweep a 100 Hz frequency range so that the response can reach its
steady-state at each resonance.
The same room response data may be gathered from a 1 s long record of the
impulse response which provides us with a 1 Hz data point resolution after the
impulse response has been Fourier transformed into the frequency domain. A
maximum length sequence signal analyzer is used to acquire the long impulse
response.
2.2.1 Very small room
Initial measurements were performed in a small office room. This room has
length-width-height dimensions of 3.45 m x 3.05 m x 2.75 m (11.3 ft x 10 ft x 9
ft). It is fully enclosed, furnished with desks, book shelves, cabinets,
pictures on the walls and has a hardwood floor. Ten percent of the room’s
surface area is double pane window glass. The woofer was placed on the floor,
approximately in the center of the room, and the microphone near an upper room
corner.
The steady-state room transfer function for this particular setup was
measured for monopolar and dipolar radiation. The two responses in Fig. 8 are
quite different from each other and neither is particularly appealing. The
narrowest peaks have a -3 dB width between 3 Hz and 4 Hz indicating an
approximate decay time of T60 = 600 ms at these resonances (Equ. 3).
The calculated eigenfrequencies are drawn as short vertical lines in these
figures. The axial modes are separated out, because they are often considered to
dominate the room response. From Equ. 5 a total of 41 modes are estimated to be
possible below 200 Hz. Of interest is the correlation between the variations in
the transfer function curve and the known eigenfrequencies.
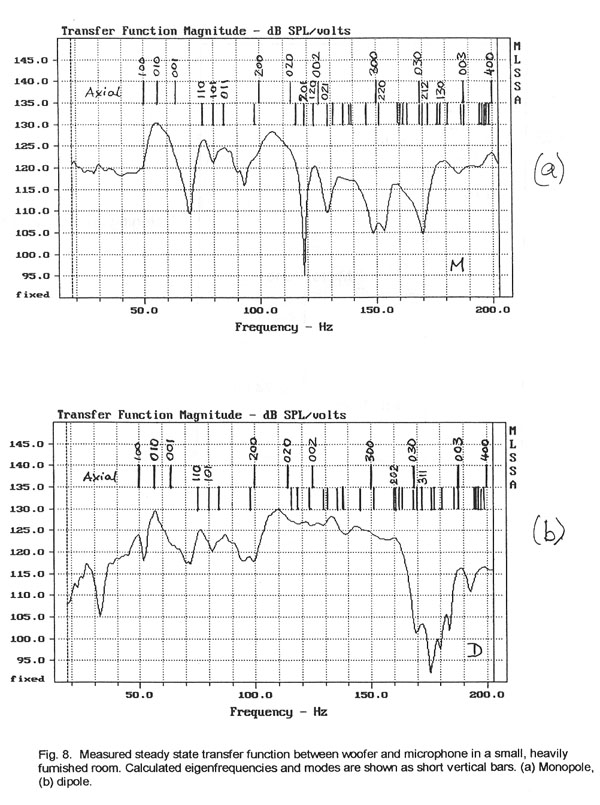
It can be seen immediately that below the 1-0-0 mode with fmin =
50 Hz the monopole response stays constant while the dipole response rolls off.
A dipolar radiator progressively looses its ability to pressurize a closed room
as frequency decreases below fmin . A comparison of the peaks and
dips in the two response curves to the eigenfrequency lines above them shows
that for this room there exists a correlation between some lines and the curve
and none for other lines. The nature of correlation, i.e. peaks or dips at the
same eigenfrequency, is occasionally the same yet often different for the two
types of radiators. The axial room modes do not dominate the curve features but
correlate more with peaks than dips for their lower orders. Tangential and
oblique mode frequencies also correlate, and more so for the monopole than for
the dipole radiator.
We must conclude from this and other similar measurements that it is nearly
impossible to predict any detail in the measured frequency response from a prior
knowledge of the room’s eigenfrequencies and their spectral distribution.
Eigenfrequency calculations are useful, though, in trying to understand how
details in the measured response curve might relate to the given room dimensions
and the placement of woofer and listener.
The two responses in Fig. 8 say little about potential quality differences
between dipolar and monopolar woofers other than that a larger number of modes
can be correlated to the monopolar response curve and that the dipolar curve
appears smoother.
2.2.2 Large room
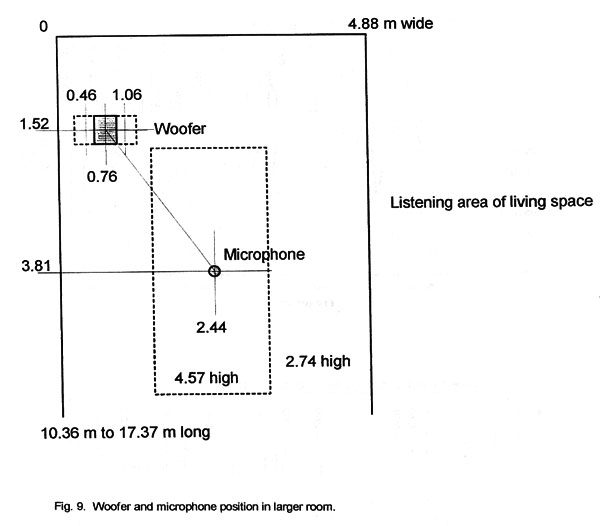
The following acoustic measurements were performed in a much larger room,
Fig. 9. Its acoustic length is difficult to define because the basic rectangle
of 4.88 m (16 ft) width and 17.37 m (57 ft) length is interrupted by openings to
a hall and a staircase and by partial walls at 10.36 m (34 ft) of its length.
The height of the room is 2.74 m (9 ft) but a section above the listening place
is raised to 4.57 m (15 ft) in form of a clarestory. The sides have large floor
to ceiling window areas. The hardwood floor is partially covered with carpets
and rugs. The room is furnished as a normal living room without further acoustic
treatment. The test woofer is placed in about the location of the left channel
woofer of the normal stereo sound system and the microphone at the listening
position.
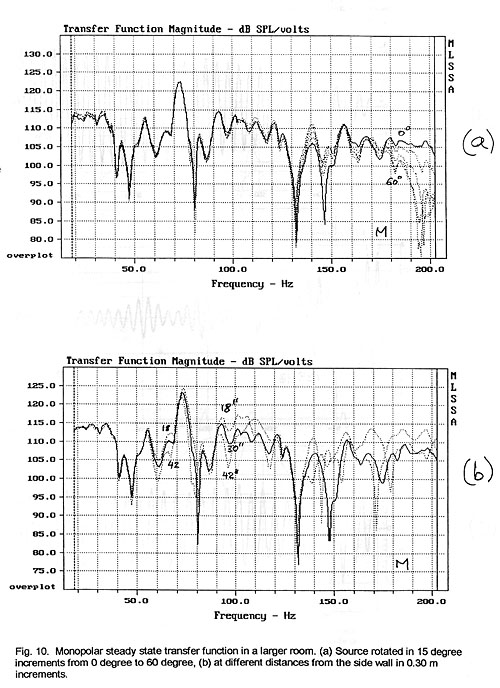
The steady-state transfer function is measured first for the monopolar
radiator as it is rotated in 15 degree increments towards the microphone and as
it is shifted laterally +/-0.30 m (1ft) from its reference position (Fig. 10).
Below 130 Hz the test woofer behaves, indeed, like a monopole but it becomes
increasingly directional at higher frequencies because of the 0.53 m (21 in)
length of the box between the drivers. The transfer function is more sensitive
to lateral shifts. The woofer output increases over a wider frequency range with
increasing proximity to the side wall (Fig. 10b) than for rotation.
The same measurements for the dipolar radiator indicate similar sensitivity
to lateral shifts but considerably different behavior versus rotation (Fig. 11).
Under free field conditions a rotation of sixty degrees from the main axis would
reduce the output to cos 600 = 0.5 or to -6 dB. The observed
variation in the room depends upon frequency but becomes more uniform above 150
Hz. Taking this and the monopolar behavior above 130 Hz into consideration we
conclude that in the frequency range above approximately 150 Hz, where mode
density becomes high, the response is dominated by the directivity of the source
and not by room modes.
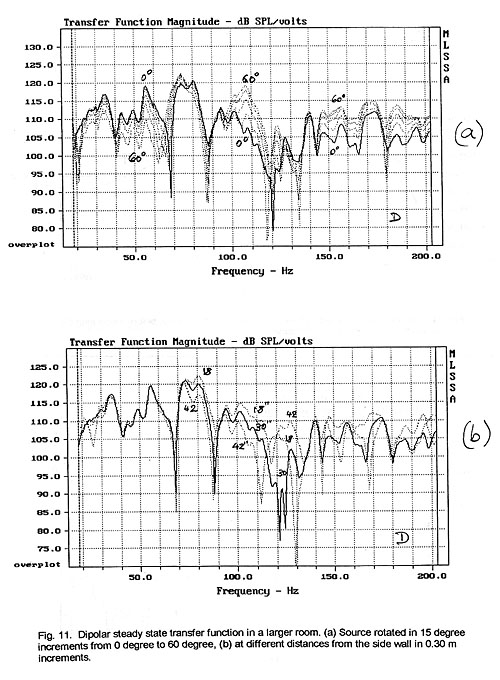
The dipolar and monopolar radiation transfer functions are quite different
from each other yet it is not obvious how to derive performance differences from
these two, purely frequency domain, steady-state response data sets.
2.3 Cumulative Spectral Decay
A display of the associated cumulative spectral decay plots, though, provides
some insight into the nature of the more dominant features of the steady-state
response (Fig. 12 to Fig. 13). The strong resonance at 73 Hz decays smoothly for
the monopole (Fig. 12) but is broken up and widened for the dipole (Fig. 13).
The dipole’s range above 100 Hz is more random in its decay from one spectrum
slice to the next one 5 ms later. Viewed from the reverse perspective (Fig. 12b,
13b), it is of interest how the deep notches in the steady-state response are
filled by the reverberant spectrum after about 20 ms of decay. It points out
that the perceptual effect of these cancellations, visible primarily in the
steady-state response, is likely to be masked and no attempt should be made to
equalize them with narrowband high gain electronic filters [11]. Equalization
would add excess narrowband sound energy to the decay.
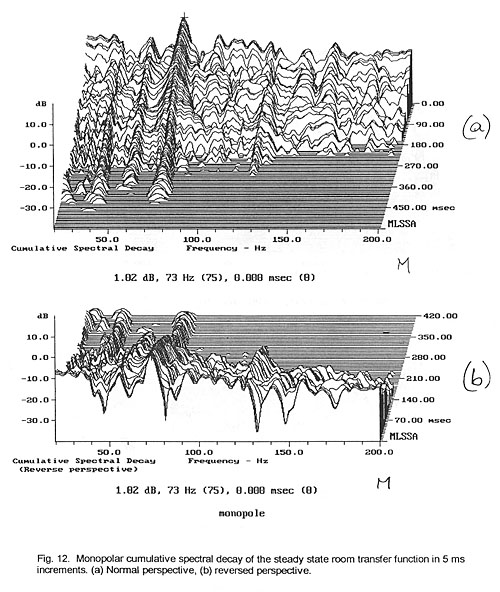
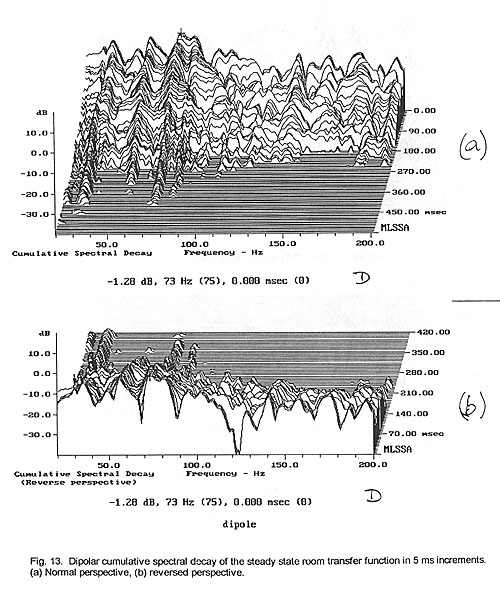
Convincing qualitative differences are difficult to derive from a visual
inspection of these decay plots, although some measure of time domain behavior
is displayed. Note that only the decay of sound with time has been shown and the
initial build up of sound pressure has been ignored [12]. This missing
information is contained in the impulse response. A display of the impulse
responses for monopolar and dipolar radiation, though, does not readily reveal
clearly discriminating features.
2.4 Energy-Time Curve
To investigate the impulse response further its spectral content is
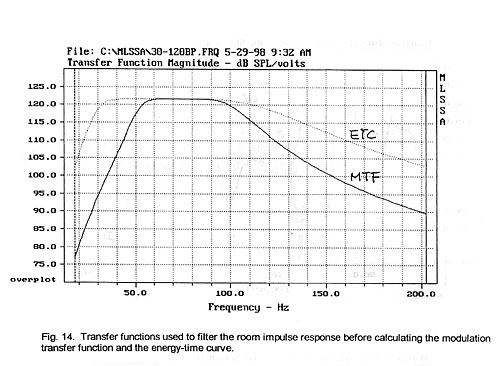
restricted to the 30 Hz to 120 Hz range of interest by bandpass filtering (Fig.
14). Then the Energy-Time Curve (ETC), i.e. the envelope of the magnitude of the
filtered impulse response, is calculated (Fig. 15). We see that the energy of
the dipole is lower after the initial response peak than that of the monopole.
Theoretically, the sound pressure of the reverberant field should be 4.8 dB
lower for an ideal dipolar radiator [5]. The initial 40 ms of sound energy, in
this example, are more separated from the remainder of the decay than for the
monopole. The monopole shows little variation over the first 120 ms before it
falls off more or less monotonically. This behavior might be influenced by the
strong 73 Hz resonance seen in Fig. 12. The temporal behavior of the dipole’s
decay in Fig. 13 is not clearly visible, but it appears to follow the
periodicity of decay in the ETC curve.
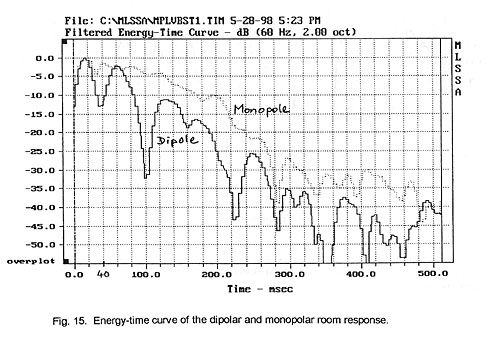
The widely reported subjective perception of greater articulation from
dipolar bass reproduction could be attributed to the lower energy after the
initial signal onset and to the gaps in reverberant energy flow. The gaps might
be caused by a less uniform spatial excitation of modes from a directional
source. These preliminary observations should be investigated further.
2.5 Modulation Transfer Function
The modulation transfer function, MTF, is typically used to analyze speech
intelligibility in reverberant spaces [13]. In principle, an octave wide band of
noise in the speech frequency range is amplitude modulated at different
modulation frequencies. The signal is radiated into the room under investigation
and monitored at different locations in the room. The reverberant field, i.e.
signals arriving from multiple directions at the receiver, tend to fill in the
valleys in the modulation envelope of the octave noise. The reduction in
modulation depth from the original 100% is measured versus modulation frequency
and is an indicator of articulation loss. Alternatively, the desired information
can be derived from the system impulse response [14 15]. The MTF describes the
time domain behavior of a system versus center frequency of the noise band and
versus modulation rate. The modulation frequency sidebands in the transmitted
spectrum are symmetrically offset above and below the center frequency. As the
modulation frequency varies the coherence between symmetrical spectral areas is
tested.
The MTF is an indicator of how well amplitude fluctuations of a signal are
preserved under the masking influence of room resonances, reverberation and
reflections. In the low frequency range the MTF should predict the preservation
of vibrato and bass instrument sonic detail.
A center frequency of 73 Hz and a one octave noise bandwidth (Fig. 14) were
chosen to measure the MTF of the living room setup over a 52 Hz to 103 Hz
frequency range for the monopolar and dipolar woofer configuration (Fig. 16). In
this frequency range the previously shown room resonances should have their
strongest effect. The two transfer functions are different and favor the dipole
at most modulation frequencies. Only between 9.5 Hz and 13 Hz is the monopole
superior, but the depth of modulation for either is very low.
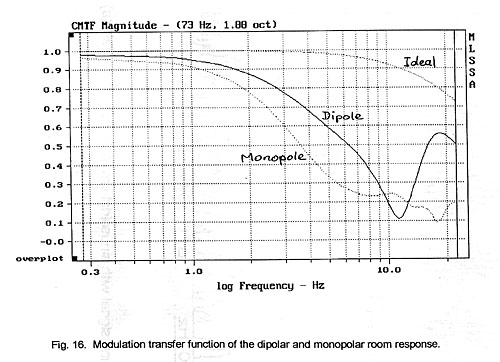
Also shown is the response of an ideal system. Its modulation depth decreases
with increasing modulation frequency because the sidebands of the amplitude
modulation spectrum are attenuated by the corners of the bandpass filter
response. The dipole and monopole curves must be compared to the ideal response
to see the actual degradation of the modulation depth due to room modes.
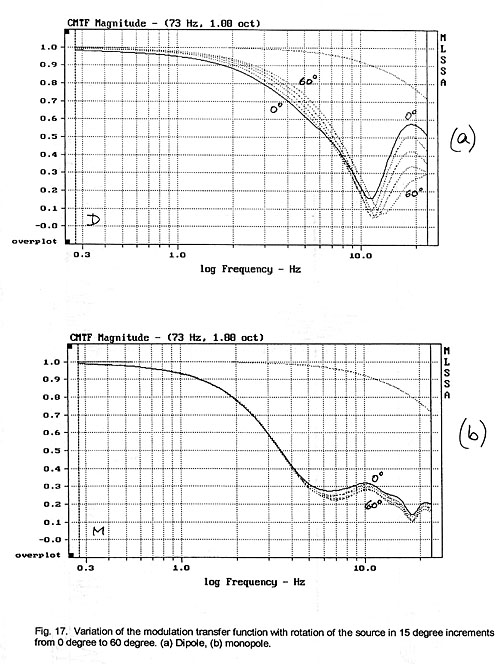
As expected the MTF is sensitive to angular rotation of the dipole source
(Fig. 17a), unlike the monopole source which is mostly insensitive to changes in
angular position (Fig. 17b). The MTF improves for the dipole in this particular
room setup for modulation rates below 10 Hz but degrades for higher rates as the
woofer is turned towards the microphone.
2.6 Single and Multiple Shaped Tone Bursts
A shaped tone burst signal consists of a few cycles of a sinewave with an
amplitude envelope from one of the standard FFT window functions. The envelope
shape and its duration determine the width and shape of its spectrum coverage
[16]. For example, a ten cycle burst with a sinusoidal envelope has a spectrum
coverage of about one-third of an octave centered at the burst frequency (Fig.
18a). The response of a system to this type of test signal is observed on an
oscilloscope. A shorter burst of fewer than ten cycles would provide faster rise
and decay times and reveal finer temporal detail about the system under test,
but would sacrifice frequency resolution by exciting more than a one-third
octave frequency range. In general, a tone burst test will show neither the
detail in amplitude response variation of the swept sine wave test nor the rapid
amplitude fluctuations of a wide band pulse test [17]. The sine wave stimulates
the system one frequency at a time while an impulse excites the system with all
frequencies simultaneously. The shaped tone burst falls somewhere in between
these two cases. Depending on the burst shape, the test signal emphasizes either
the steady-state or the transient characteristics of a system. A further benefit
of this method stems from the fact that our hearing responds to both temporal
and timbrel cues and the shaped tone burst is thought to elicit a system
response that is closer to the way we perceive sound.
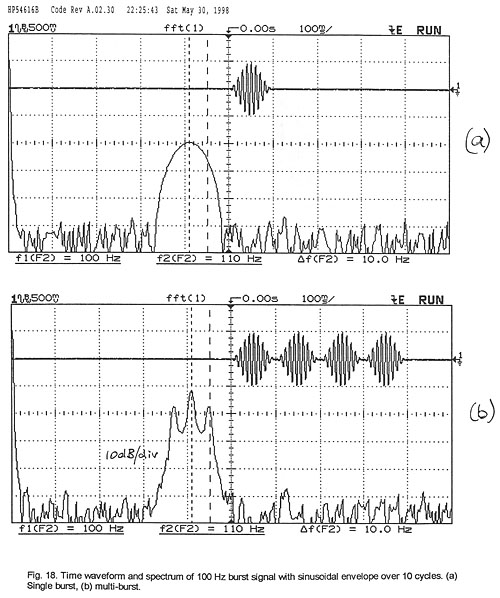
When multiple shaped tone bursts are strung together, then the resulting
signal has the characteristics of a short section of a 100% amplitude modulated
waveform (Fig. 18b). The modulation rate fM for a burst of n cycles
of frequency fB is
fM = fB / n [Hz] (12)
Four bursts of 10 cycles each of a 100 Hz sine wave would thus represent a 40
cycle section of a 100 Hz carrier which is 100% amplitude modulated at 10 Hz
rate.
The multi-burst waveform has some similarity to the test signal used for the
MTF measurement [12]. The difference being that the octave band of noise has
been replaced by a continuous sine wave as carrier of the modulation and the
modulation rate has become a fixed percentage of the carrier frequency.
With four bursts of a 100 Hz carrier the duration of the test signal becomes
400 ms. This is longer than the 230 ms rise time (Equ. 4) of a typical 3 Hz wide
peak in the steady-state frequency response. The system response to the
multi-burst signal will, therefore, reach its steady-state. The forty cycle test
signal seems well suited for room measurements below 200 Hz. The signal is
generated with an arbitrary waveform generator (HP 33120A) and observed on an
oscilloscope with digital storage (HP 54616B). Other test signals were tried,
such as a 5 Hz amplitude modulated continuous carrier or two bursts for the
multi-burst signal. The four burst signal was found to be superior in providing
timbrel and temporal information about the room response.
When the received signal is observed on an oscilloscope and listened to at
the microphone location or through the microphone, changes in waveform
appearance on the oscilloscope can be related to subjectively perceived
variations in sound character. Similar to the MTF, on the oscilloscope we expect
to see a degradation of the modulation envelope due to room resonances.
The multi-burst transfer function was measured using the same setup of woofer
and microphone as was used for the steady-state frequency response measurements
above. When the monopolar and dipolar responses are compared to the steady-state
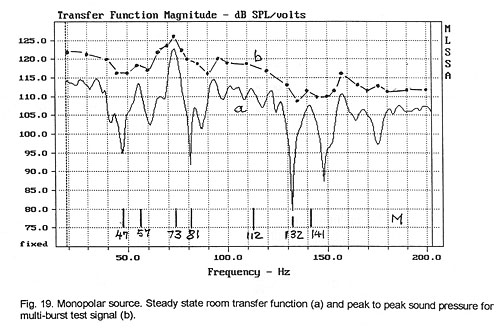
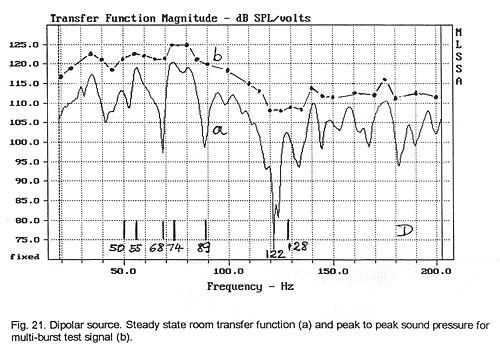
responses (Fig. 19 and Fig. 21), then the smoothing effect of the test signal
upon the transfer function is readily seen. The peak-to-peak amplitude of the
burst as read from the oscilloscope was converted to dB and plotted. The same
measurement could be carried out with a peak reading sound level meter (e.g. RS
33-2055). The amplitude variation of the burst response from frequency to
frequency corresponds much more closely to what is heard with program material
than the variation seen in the steady-state response. These variations are also
easily audible.
Of particular interest is the relationship between the different details of
the steady-state frequency response when compared with the waveform of the
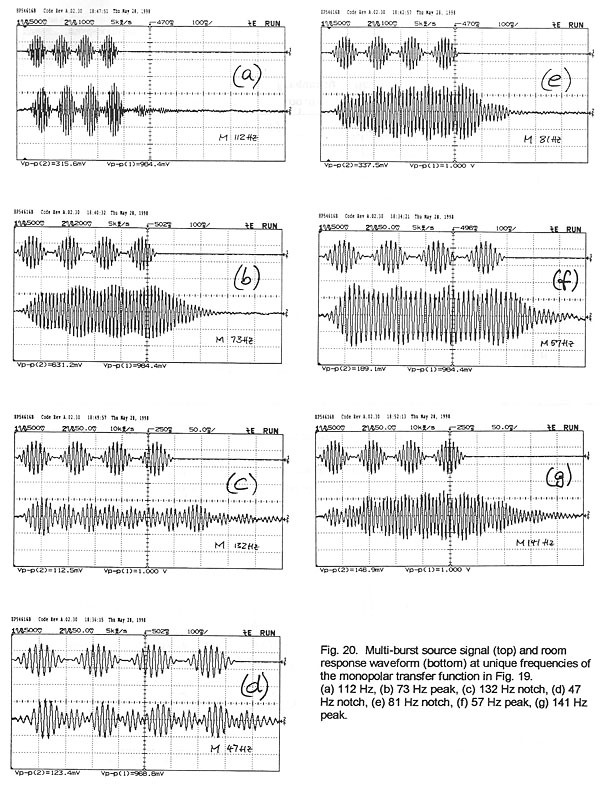
multi-burst signal. For example, at 112 Hz of Fig. 19 there is a slight
degradation of the waveform (Fig. 20a), but the signal is well articulated when
listened to at the microphone location, which means that the 11.2 Hz modulation
is audibly well preserved. At 73 Hz, though, the modulation has almost
disappeared (Fig. 20b). The sound drones on and is quite loud. Investigating the
cancellation notch at 132 Hz we find not only a loss in articulation (Fig. 20c)
but also a change in sound character and timbre. The modulation envelope appears
to have twice the original rate. The effect is caused by the interference of two
modes with opposing phase shifts. In some cases this is audible as out-of-phase
sound arriving from two different directions. Similar effects can be observed at
47 Hz (Fig. 20d) and 81 Hz (Fig. 20e). The peak in the steady-state response at
57 Hz produces a loss in articulation of the burst (Fig. 20f), but the peak at
141 Hz (Fig. 20g) causes less of a perceived loss even though the waveform would
suggest otherwise.
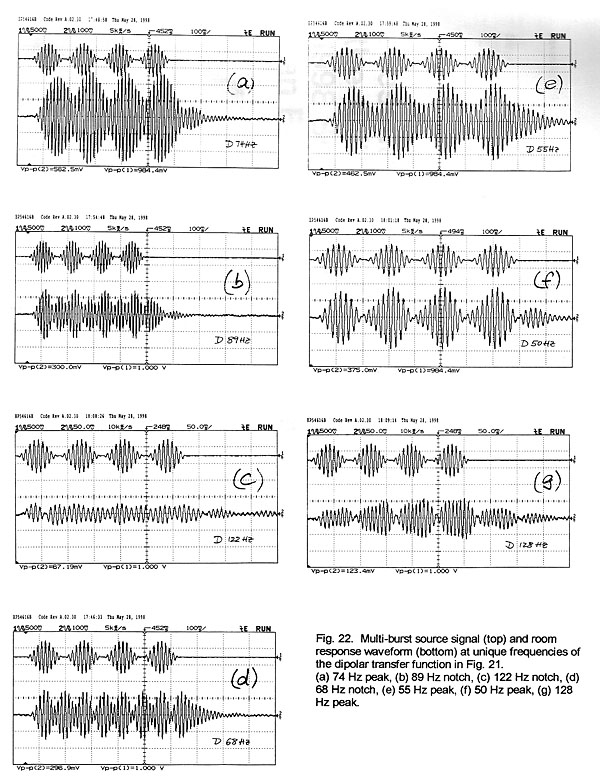
When we examine the dipolar burst response (Fig. 21) at the 74 Hz peak in the
steady-state frequency response, we find that the signal is audibly louder at
this peak but the articulation is not smeared (Fig. 22a). The dip at 89 Hz still
maintains articulation, again, not in full agreement with the observed waveform
(Fig. 22b). The dip at 122 Hz, though, is associated with a significant audible
deterioration of the signal (Fig. 22c), as is the notch at 68 Hz (Fig. 22d). The
behavior at peaks in the frequency response is also not always consistent. The
peak at 55 Hz is perceived as degrading the modulation (Fig. 22e), while the
peaks at 50 Hz and 128 Hz maintain good articulation (Fig. 22f and Fig. 22g).
It is difficult to show pictorially and quantitatively the perceived
differences when listening to the reproduced multi-burst test signal from a
monopolar and a dipolar low frequency radiator in a room. After examining the
two steady-state frequency responses with the multi-burst signal over the whole
frequency range under investigation and in small 1 Hz frequency increments, it
was concluded that the dipolar radiator has fewer and less pronounced regions of
loss in articulation, on average, than the monopolar radiator. The strong 73 Hz
resonance excited by the monopole is a major factor in its subjectively degraded
performance. This might be correctable by electronic equalization but the dipole
would require less of such remedy since it inherently couples to fewer room
modes.
3 DISCUSSION AND CONCLUSIONS
This investigation into sound quality differences between monopolar and
dipolar woofers in small rooms has shown the difficulty of relating visual
displays of various forms of data to perceived sound differences. It has also
shown the difficulty of finding those parameters that should be measured in
order to explain what is heard. This work should be considered as preliminary
and encourage other investigators to search further. Several conclusions can be
drawn, though, from the investigation into low frequency sound reproduction from
directional and non-directional woofers in small rooms.
The multi-burst test signal is an
audible indicator of quality differences.
A valuable outcome of the investigation is the development of the multi-burst
test signal. Its frequency should be adjustable in < 2 Hz increments
between 20 Hz and 120 Hz and in < 5 Hz steps up to 200 Hz. The time
intervall between bursts is preferably > 1.5 s to give the auditory
system time to reset.
The test signal is well suited for objective and subjective evaluation of low
frequency room acoustics. At any given test frequency we can hear not only the
sound pressure variation versus location in the room as we walk around, but more
importantly we can hear changes in sound quality in the form of articulation
versus "boom" or "muddiness". The test signal allows one to
hear the effect of changing woofer placement or listening position upon
articulation and uniformity of frequency response. It can be used to evaluate
the subjective effect of low frequency room equalization or to determine the
placement and effectiveness of sound absorbers.
The investigation showed that measurable and audible quality differences
exist between monopolar and dipolar woofers due to differences in their
respective interactions with the room. The degree of these differences is
difficult to predict and will depend upon the specifics of a room and the
placement of woofer and listener. However, the dipolar source can be expected to
interact less strongly with the room and will, therefore, on average convey
greater detail and resolution of complex low frequency material.
4 REFERENCES
[1] J. Salmi, Dipole Source Placement in a Room, 92nd AES Convention, 1992
Vienna, Preprint 3327
[2] C. Ferekidis and U. Kempe, Room Mode Excitation of Dipolar and Monopolar
Low Frequency Sources, 100th AES Convention, 1996 Copenhagen, Preprint 4193
[3] S. Linkwitz, Development of a Compact Dipole Loudspeaker, 93rd AES
Convention, 1992 San Francisco, Preprint 3431
[4] H. Kuttruff, Room Acoustics, John Wiley & Sons, 1973, ISBN
0-470-51105-2
[5] L. L. Beranek, Acoustics, McGraw-Hill, New York, 1954, Chapter 4
[6] O. J. Bonello, A New Criterion for the Distribution of Normal Room Modes,
J. Audio Eng. Soc., Vol. 29, No. 9, 1981 September, pp. 597-606
[7] R. Walker, Optimum Dimension Ratios for Small Rooms, 100th AES
Convention, 1996 Copenhagen, Preprint 4191
[8] T. Salava, Acoustic Load and Transfer Functions in Rooms at Low
Frequencies, J. Audio Eng. Soc., Vol. 36, No. 10, 1988 October, pp. 763-775
[9] T. Salava, Low-Frequency Performance of Listening Rooms for Steady-State
and Transient Signals, J. Audio Eng. Soc., Vol. 39, No. 11, 1991 November, pp.
853-863
[10] K. O. Ballagh, Optimum Loudspeaker Placement Near Reflecting Planes, J.
Audio Eng. Soc., Vol. 31 No. 12, 1983 December, pp. 931-935
[11] P. Craven, M. Gerzon, Compensating Filters, US Patent 5,511,129, April
23, 1996, Background of the Invention
[12] G. Adams, Time Dependence of Loudspeaker Power Output in Small Rooms, J.
Audio Eng. Soc., Vol. 37, No. 4, 1989 April, pp. 203-209
[13] T. Houtgast, H.J.M. Steeneken, The Modulation Transfer Function in Room
Acoustics as a Predictor of Speech Intelligibility, Acustica, Vol. 28, 1973, pp.
66-73
[14] M. R. Schroeder, Modulation Transfer Functions: Definition and
Measurement, Acustica, Vol. 49, 1981, pp. 179-182
[15] D. D. Rife, Modulation Transfer Function Measurement with Maximum-Length
Sequences, J. Audio Eng. Soc., Vol. 40, No. 10, 1992 October, pp. 779-790
[16] S. Linkwitz, Shaped Tone-Burst Testing, J. Audio Eng. Soc., Vol. 28, No.
4, 1980 April, pp. 250-258
[17] O. Dossing, Uncertainty in Time/Frequency Domain Representations, Sound
and Vibration, Vol. 32, No. 1, January 1998, pp. 14-24
[18] Observation based on transfer function measurements in a solid walled
room of 8.74 m x 5.69 m x 3.15 m (L x W x H) with predominantly length modes at
multiples of 19.7 Hz, at residence of S. Dickson, Honolulu, Hawaii, May 1998
----------------------------------------------------------------------
See also:
Keith Holland, Philip Newell, Peter Mapp, "Modulation Depth as a Measure
of Loudspeaker Low Frequency Performance", Proceedings of the Institute of
Acoustics, Vol.26, Pt.8.2004