
|
|
|
Woofer measurements
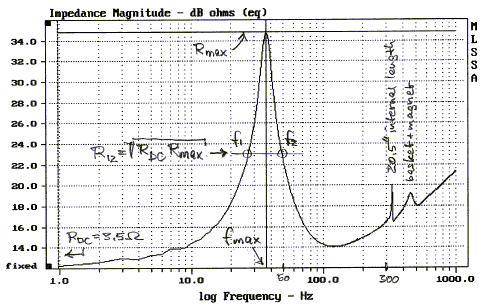
Once F0 and Q0 are known we can predict the acoustic frequency response curve, because we then know the location of the two poles of the 2nd order acoustic highpass filter, that is formed by a driver in a closed box. ( 12db-hpf.gif ) The calculation of the pole frequencies and the component
values of the simplified impedance model is carried out with closed-box1.xls.
Block 1 of the [Test] sheet is used for this.
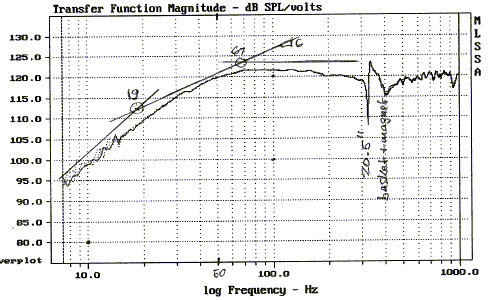
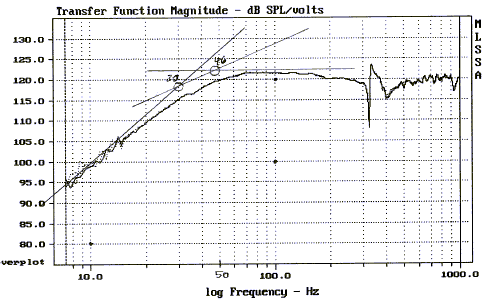
2 - Frequency response
The straight line asymptotes of 12 dB/oct and 6 dB/oct slope for the calculated poles at 19 Hz and 67 Hz give only a marginal fit to the measured response. A better approximation appears to be with poles at 30 Hz and 46 Hz, as in the following graph.
These values will be taken as starting frequencies for
equalization. Note that the calculated values on the [Spec's] sheet, 18 Hz and
72 Hz in block 2a, correspond closely to those derived from the impedance
measurement (19 Hz and 67 Hz) above. It shows that the models used are
consistent with each other, but they do not fully represent reality. Still, they
are useful tools to get close to it. In many cases I have found close agreement
between impedance and frequency response measurement results, but usually Q0 is
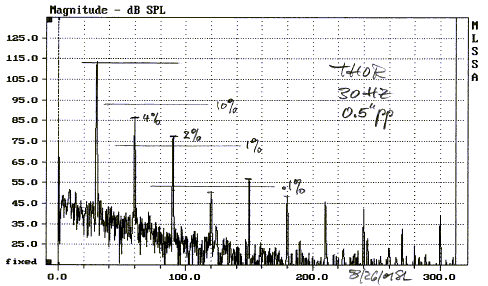
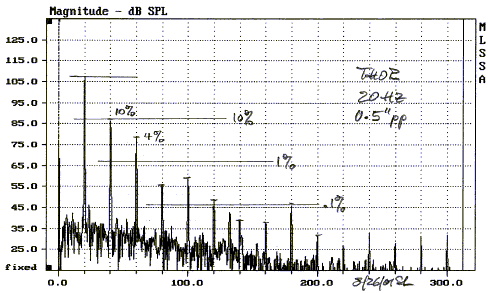
greater than 0.4. 3 - Non-linear distortion
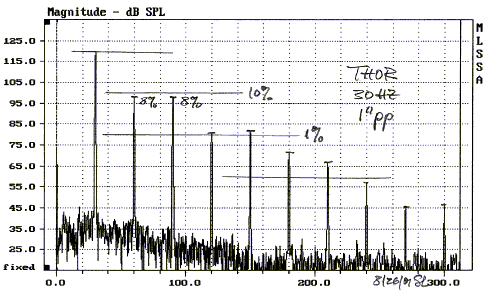
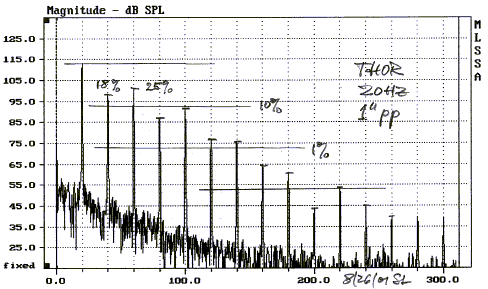
Distortion is higher at 20 Hz than at 30 Hz even though the displacement is the same. This is a curious result. The fundamental drops 40log(30/20) = 7 dB, as expected. The 2nd and 3rd harmonics, though, remain at nearly the same sound level, as the voice coil swings through the same range for each of the excursion dependent non-linear parameters. Thus the distortion percentage increases. Repeating the measurement with twice the drive voltage for a targeted 1" p-p excursion clearly shows the limits of output capability.
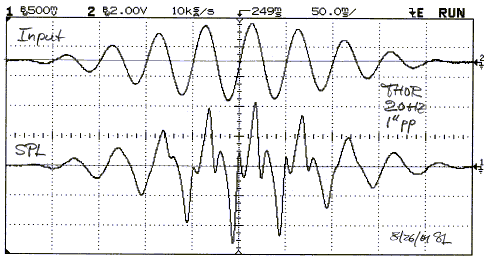
While 1" p-p is marginally useable at 30 Hz it is clearly leading to gross distortion at 20 Hz. At most 0.5" p-p can be counted on at 20 Hz. The single input tone generates a rich spectrum of harmonics, which extends into the midrange regardless of any crossover. While there is plenty of sound output it is a poor representation of a 20 Hz tone. It is interesting to note that a 830500 driver in an open baffle has somewhat lower distortion at the same excursions and frequencies as above. The enclosed air in the THOR box stiffens and linearizes the driver suspension, but it also causes more roll-off in low frequency response. Thus the distortion generated harmonics are of higher amplitude for the closed box than the open baffle. In addition, linearizing the compliance does not necessarily lead to better overall driver performance, because it might change the degree of cancellation that existed between different distortion mechanisms. The acoustic output at the same excursion, though, is higher for the closed box. A 10-cycle shaped tone burst at 20 Hz with cosine envelope gives a picture of the time waveform distortion as the excursions build up to 1" p-p and then decrease towards zero.
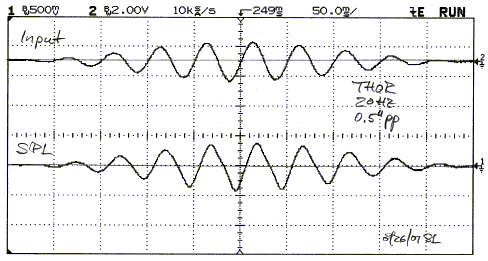
The rapid changes in the waveform indicate the many high frequency spectral components. A reduction in amplitude to 0.5" p-p gives a better replica of the input, but distortion is still recognizable by the slightly triangular shape at large amplitudes.
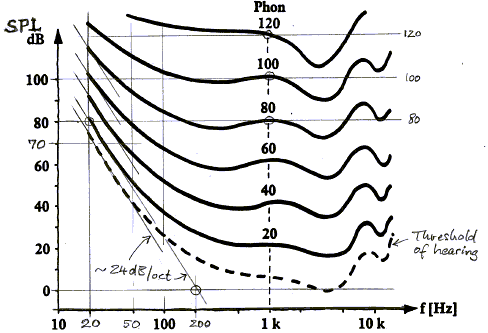
The large signal behavior of a driver and its effects upon the radiated sound quality are quite complicated. In the case of THOR one should not count on more than 0.5" excursion at 20 Hz or 0.75" p-p at 30 Hz. For accurate very low frequency reproduction it will almost always be necessary to place at least two THOR units in a room to obtain sufficiently low distortion levels. The importance of low distortion at very low frequencies can be deduced from the equal loudness contours. The threshold of hearing is around 70 dB SPL at 20 Hz. This is at the level of normal conversation. With increasing frequency the threshold drops rapidly. The loudness contours have an initial slope of 80 dB/dec, or 24 dB/oct, at low perceived volume levels (phon). This means that if the 40 Hz 2nd harmonic of a 20 Hz tone is at
a 24 dB lower level, then it will sound equally as loud as the fundamental. This
corresponds to 6% 2nd harmonic distortion. The 3rd harmonic distortion would
have to be below 1%, or over 38 dB down, in order that it is less loud than the 20
Hz fundamental. It all leads to very low distortion requirements. The
fundamental frequency sound pressure level needs to be above 70 dB to even become audible
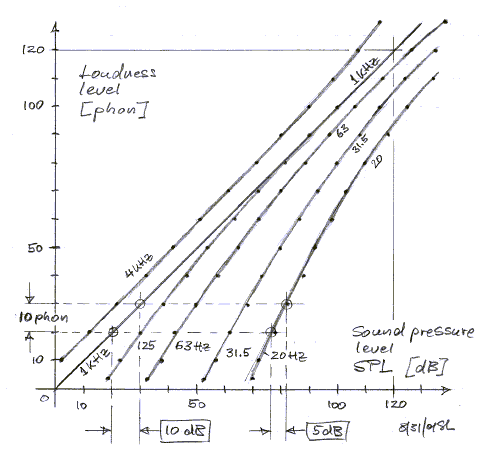
and it should not be masked by higher frequency distortion products. The equal loudness contours of the graph above are bunched more tightly together at low frequencies. Re-drawing such graph in terms of perceived loudness (phon) versus sound pressure level in dB SPL for different frequencies, it shows us the sensitivity we have to changes in low frequency level adjustment.
A change of 10 phon corresponds to a perceived doubling of loudness. At 1 KHz the SPL must change (by definition) 10 dB to obtain this doubling, but at 20 Hz it takes only about 5 dB for the same effect. This is the reason why changes of only a few dB in subwoofer level setting have a large perceived effect. Adding a second subwoofer for 6 dB more SPL, or for lower distortion at the initial SPL, can give the subjective benefits of up to 12 phon.
|
|
| ||||

