
|
|
|
Room Acoustics---- Theory ---- The best rooms ---- The listening room ---- Whatever happened ----
TheoryA - Introduction B - Loudspeaker directivity and room response C - Room reverberation time T60 D - Loudspeaker and listener placement WATSON - Stereo Enhancement
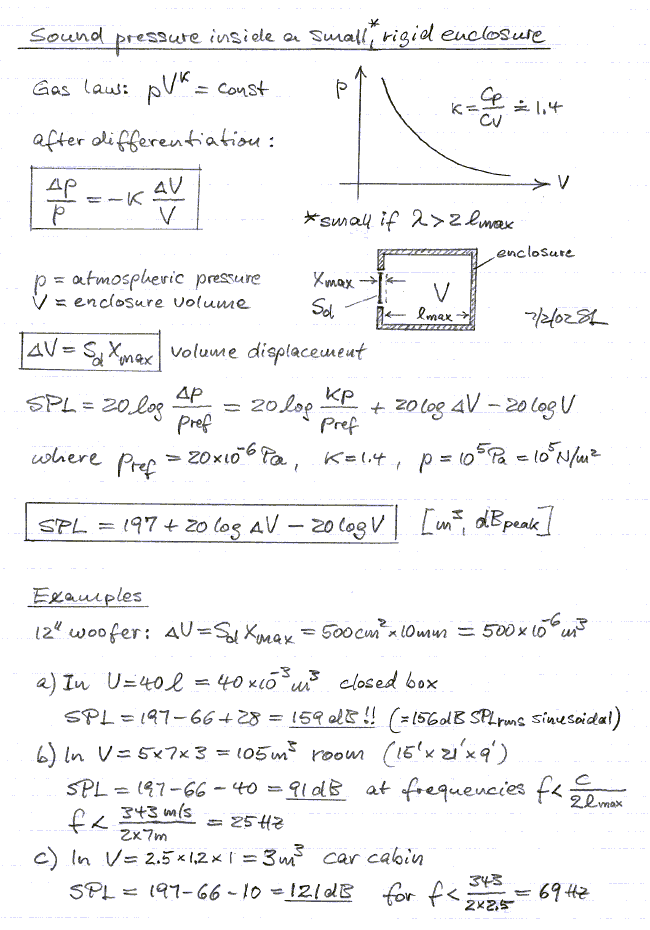
Loudspeakers as a merging of room acoustics and auditory perception A - IntroductionMuch has been written in the popular and professional audio press about the acoustic treatment of rooms. The purpose of such treatment is to allow us to hear more of the loudspeaker and less of the room. I am convinced that a properly designed sound system can perform well in a great variety of rooms and requires only a minimum of room treatment if any at all. To understand this claim let's look at the typical acoustic behavior of domestic size listening rooms, which have linear dimensions that are small compared to the 17 m wavelength of a 20 Hz bass tone, but are acoustically large when compared to a 200 Hz or 1.7 m wavelength midrange tone (G1 on the piano keyboard). Below 200 Hz the acoustics of different locations in the room are dominated by discrete resonances. Above 200 Hz these resonances become so tightly packed in frequency and space that the room behaves quite uniformly and is best described by its reverberation time RT60 (Ref. 1). Room treatment can be very effective above 200 Hz, but the same result may be obtained more aesthetically with ordinary furnishings, wall decoration, rugs on the floor and the variety of stuff we like to surround ourselves with. How much treatment is needed, or how short the reverberation time should be, depends on the polar radiation characteristics of the loudspeaker. For my open baffle speaker designs a room becomes too dead when its RT60 falls below 500 ms. We can think of sound as propagating like a light ray. Thus, we can use a mirror to find the region on the side wall or ceiling where sound from the speaker might be reflected towards the preferred listening location. It depends on driver, crossover and baffle design, i.e. the polar radiation pattern, whether the region so found is illuminated by sound to any significant degree. If so, then a variety of commercial surface coverings are available to scatter and/or absorb the offending reflection. The acoustically most problematic frequency range is below 200 Hz, because of the spatially and frequency wise irregular distribution of room resonances. Many computer programs have been written that calculate the resonant modes of a given room and recommend optimum loudspeaker and listener placements. Usually, real rooms are much more complex than the calculated models. Walls are not infinitely stiff, rooms have windows, doors, openings, suspended floors or ceilings, etc. In addition, it is the polar pattern and the acoustic source impedance of the given loudspeaker that determines which of the potential room modes are actually excited and to which degree. The usefulness of such programs is marginal at best. Likewise, recommended proportions for room length, width and height should not be taken more seriously than other proportions that may be based on visual aesthetics. The conventional closed or vented box design, that is used for the majority of loudspeakers on the market, contributes significantly to the room problems below 200 Hz. These designs are omni-directional radiators and they tend to excite a maximum number of room resonances, particularly when located in room corners. While this adds to the perceived bass output at certain frequencies, it can lead to a falsification of the recorded material, namely when the room resonance decays more slowly than the original sound. In general, the low frequency response of omni-directional speakers in small rooms is quite non-uniform. Attempts to treat the room with absorbers will make only marginal differences unless very many absorbers or large absorbing surfaces are used. It is best to attenuate peaks in the bass response with parametric equalization. Holes in the response cannot be filled in (Ref. 1). By far the perceptually most uniform response in the range below 200 Hz is obtained with an open-baffle, dipole or figure-of-eight radiating source. Because of its directionality, the dipole excites far fewer room resonances than an omni-directional source. The measured room response is not necessarily any smoother than that for an omni-directional source. But the perceived difference in bass reproduction is startling at first, because we are so used to hearing the irregular and booming bass of the typical box speaker in acoustically small rooms. Quickly one learns to recognize the distortion of this combination and it becomes intolerable. For evaluating a given room and loudspeaker combination a CD is available. It contains unique sound tracks to identify room resonances and their effect upon the clarity of sound reproduction. Many of the tests require no instrumentation other than your ears. A ripple tank experiment illustrates wave propagation and reflection in a single plane and gives an indication of the complexity of sound propagation in acoustically small spaces like living rooms. Also see and listen to a talk about "Accurate sound reproduction from two loudspeakers in a living room" under Publications #23 and read the "Room optimized stereophonic sound reproduction" page.)
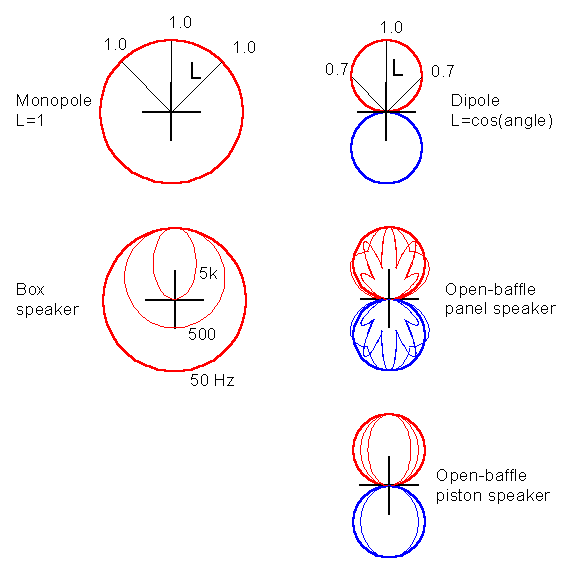
B - Loudspeaker directivity and room responseWhen a loudspeaker is placed in a room we hear both its direct sound, i.e. the sound which arrives via the shortest path, and the room sound due to the resonances, reverberation and reflections caused by the boundaries of the room and the objects in it. The two sounds superimpose and influence our perception of timbre, timing and spatial location of the virtual sound source. Thus, the off-axis radiation of the speaker has great influence on the naturalness of sound reproduction even when you listen on-axis and the more so, the further you sit away from the speaker. Two basic and fundamentally different sources of sound are
the monopole and the dipole radiator. The ideal monopole is an acoustically
small pulsating sphere, and the ideal dipole is a back and forth oscillating
small sphere. The monopole radiates uniformly into all directions, whereas the
dipole is directional with distinct nulls in the plane vertical to its axis of
oscillation. The 3-dimensional radiation or polar pattern of the monopole is
like the surface of a basketball, the dipole's is like two ping-pong balls
stuck together. At +/-45 degrees off-axis the dipole response is L = cos(45) =
0.7 or 3 dB down, the monopole is unchanged with L = 1. The graph above shows characteristic radiation patterns of
different sound sources for very low, mid and high frequencies and with flat
on-axis response. The ideal monopole is omni-directional at all frequencies. Very few speaker designs on the consumer market approach this behavior. This type of speaker illuminates the listening room uniformly and the perceived sound is strongly influenced by the room's acoustic signature. The result can be quite pleasing, though, because a great deal of acoustic averaging of the sound radiated into every direction takes place. The speakers tend to disappear completely in the wide sound field. Unfortunately, the direct sound is maximally masked by the room sound and precise imaging is lost, unless the listening position is close to the speakers. The typical box speaker, whether vented, band-passed or closed, is omni-directional at low frequencies and becomes increasingly forward-directional towards higher frequencies. Even when flat on-axis, the total acoustic power radiated into the room drops typically 10 dB (10x) or more between low and high frequencies. The uneven power response and the associated strong excitation of low frequency room modes contributes to the familiar (and often desired :-( ) generic box loudspeaker sound. This cannot be the avenue to sound reproduction that is true to the original. The directional response of the ideal dipole is obtained with open baffle speakers at low frequencies. Note, that to obtain the same on-axis sound pressure level as from a monopole, a dipole needs to radiate only 1/3rd of the monopole's power into the room. This means 4.8 dB less contribution of the room's acoustic signature to the perceived sound. It might also mean 4.8 dB less sound for your neighbor, or that much more sound to you. Despite this advantage dipole speakers are often not acceptable, because they tend to be constructed as physically large panels that interfere with room aesthetics, and they seem to suffer from insufficient bass output, critical room placement and a narrow "sweet spot". These claims are true to varying degree depending on the specific design of a given panel loudspeaker. Because of the progressive acoustic short circuit between front and rear as the reproduced signal frequency decreases, the membrane of an open-baffle speaker has to move more air locally than the driver cone of a box speaker for the same SPL at the listening position. This demands a large radiating surface area, because achievable excursions are usually small for electrostatic or magnetic panel drive. The obtained volume displacement limits the maximum bass output. Non-linear distortion, though, is often much lower than for dynamic drivers. Large radiating area means that the panel becomes multi-directional with increasing frequency which contributes to critical room placement and listening position. If the open-baffle speaker is built with conventional cone
type dynamic drivers of large excursion capability, then adequate bass output
and uniform off-axis radiation are readily obtainable in a package that is more
acceptable than a large panel, though not as small as a box speaker. Such
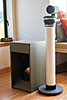
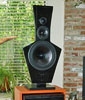
speakers were built by Audio Artistry Inc. and a DIY project is described on
this web site in the PHOENIX pages. This type of speaker has a much more
uniform power response than the typical box speaker. Not only is its bass output
in proportion to the music, because room resonance contribution is greatly
reduced, but also the character of the bass now sounds more like that from real
musical instruments. My hypothesis is that three effects combine to produce
the greater bass clarity: The off-axis radiation behavior of a speaker determines the degree to which speaker placement and room acoustics degrade the accuracy of the perceived sound. Worst in this respect is the typical box speaker, followed by the large panel area dipole and the truly omni-directional designs. Least affected is the sound of the open-baffle speaker with piston drivers. (Ref.1) Often concern is expressed over the fact that the rear
radiation from a dipole is out of phase with the front radiation, and that
thus any sound reflected from a wall behind the speaker would cancel sound
coming from the front of the speaker. Cancellation can only occur when direct
and reflected sounds are exactly of opposite phase (180 degrees) and of the same
strength. Since direct and reflected sounds travel paths of different length,
they undergo different amounts of phase shift. Thus, the phase and magnitude
conditions for cancellation are given only at certain frequencies, if at all. At
some other frequencies direct and reflected sounds will add. The same also
applies to a monopole speaker in front of a wall. The only difference is in the
frequencies for which addition and subtraction occur. The best remedy is to move
the speaker away from the wall, or to make the wall as sound absorptive or
diffusive as possible. (FAQ31)
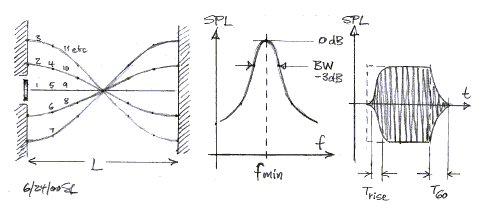
C - Room reverberation time T60Reverberation time is the single most important parameter describing a room's acoustic behavior. The following discussion might get a little technical but will illustrate how sound builds up and decays in a room and the effect it has upon clarity of reproduction. C1 - Sound waves between two walls
This is a standing wave resonance or mode condition and if we change the frequency of cone vibration, we trace out the resonance curve that is typical for any simple system containing mass, compliance and energy loss. As frequency is increased another resonance occurs when L equals to a full wavelength, to 3/2 wavelengths, 4/2 and so on. The lowest possible frequency is fmin = c / (2 L) Hz, where c=343 m/s (1) If the excitation is applied as a step function, then the sound pressure will rise from 10% to 90% of its steady-state level within a time Trise = 0.7 / BW (2) where BW is the width of the resonance curve in Hz at the half power (-3 dB) level. The SPL will decay to one thousand's (-60 dB) of its full level after a time T60 = 2.2 / BW (3) The quality factor or Q of the resonance is Q = n fmin / BW (4) with n = 1, 2, 3, etc. Example 1 C2 - Standing waves in a rectangular, rigid room f = ( c / 2 ) [ ( l / L )2 + ( w / W )2 + ( h / H )2 ]1/2 [Hz] (5) l, w, h = 0, 1, 2, 3 etc. See modes1.xls, a spreadsheet for calculating and plotting room modes and other room parameters discussed here. At frequencies below the lowest room resonance the sound
pressure will increase at a rate of 12 dB/oct for a closed box speaker that is
flat under anechoic conditions, assuming that the room is completely closed and
its surfaces are rigid. This case has some significance for the interior of
automobiles. Under the same circumstances the sound from a dipole speaker will
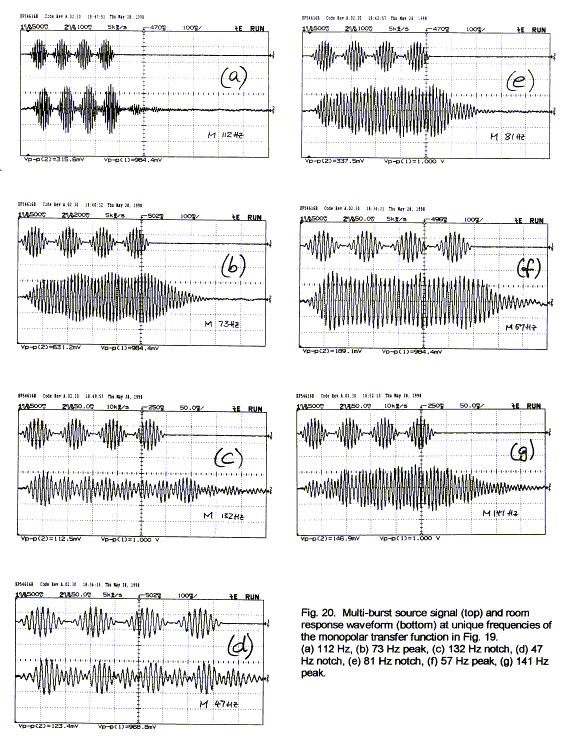
stay flat. Note: Calculations of room modes, though popular, are not practical for predicting optimum speaker placement or listener position. For this one would need to calculate the transfer function between speaker and listener. The transfer function is related to the room modes, but much more difficult to determine. Never-the-less, room mode calculations are often invoked to predict "optimum" room dimensions. They fail to take into account any specifics about speaker placement, source directivity and source type (monopole vs. dipole) that determine which modes are excited, and in combination with the absorption properties of different room surfaces, to which degree these resonances build up. Some people think that by making the room other than rectangular or using curved surfaces, that they can eliminate standing waves. They merely change frequencies, shift their distribution and make their calculation a lot more difficult. Room modes can be identified by peaks and dips in the frequency response of the acoustic transfer function between speaker and listening position, though only at low frequencies (<150 Hz) where their density is not too high. Such measurements are location dependent and are difficult to interpret as to their audible effect. Listening to a multi-burst test signal at different frequencies gives audible indication of which room locations and frequency regions suffer the greatest degradation in the articulation of bass sounds (Ref.1). With this information in hand it is then possible to identify and electronically equalize the worst offenders in the acoustic transfer function response. Several room parameters can be calculated that give insight into the general behavior of a closed space. The number of modes N between zero and a given upper frequency limit fm can be estimated (H. Kuttruff, Room Acoustics, 1991) from N = (4 p / 3) V (fm/c)3 + (p / 4) S (fm /c)2 + (1 / 8) Le (fm /c) (6) where The number of modes increases very rapidly with frequency and they move ever more closely together. Their average separation at fm is df = c3 / ( 4 p V fm2 ) [Hz] (7) Example 2
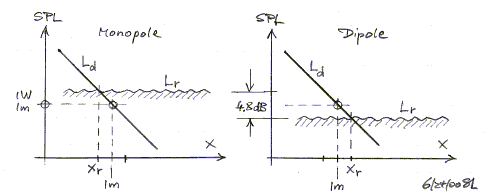
If we assume that the modes in this room decay at T60 = 630 ms, then each resonance occupies a 3 dB bandwidth BW = 3.5 Hz from (3) above. Somewhere between 100 Hz and 200 Hz the average separation df between modes is 1.2 Hz and thus 3 modes fall within the 3.5 Hz bandwidth resulting from T60. This occurs at fs = 157 Hz as calculated from the simple formula for 3 overlapping modes per BW: fs = 2000 ( T60 / V )1/2 [Hz] (8) The frequency fs is also called the Schroeder frequency and denotes approximately the boundary between reverberant room behavior above and discrete room modes below. The sound decay time or reverberation time T60 is related to the average wall absorption coefficient a by Sabine's formula T60 = 0.163 V / ( S a ) [s] (9) a = 18% for the Example 2 room with T60 = 630 ms. A CD containing unique test signals is available. It allows to evaluate the effect of room modes upon the clarity of sound reproduction. C3 - Reverberation distance xr = 0.1 ( G V / (p T60) )1/2 [m] (10) where the directionality gain G is unity for a monopole and G = 3 for a dipole radiator. A dipole, thus, has a 31/2 = 1.73 times larger reverberation distance.
A typical reverberation distance is actually quite small, 0.72 m (2.4 ft) for the monopole and 1.24 m (4.1 ft) for the dipole in the example room. Never-the-less, the ratio of direct sound Ld to reverberant sound pressure level Lr is 4.8 dB greater for the dipole than for a monopole with the same direct sound output. Thus, at 3 m distance from the source, the direct sound would be 20*log(3/0.72) = 12.4 dB below the reverberant sound field for the monopole and only 20*log(3/1.24) = 7.7 dB below it for the dipole. The 4.8 dB lower level of the reverberant field in the
case of the dipole significantly reduces the masking influence of the room upon
sonic detail. It eliminates the sensation of overload of the room during loud
passages of program material and makes your listening sessions much less noisy
to your neighbors. C4 - Rooms for multi-channel sound T60 = 0.3 (V/V0)1/3 [s] where V0 = 100 m3 (11) with a tolerance of +/-50 ms which is allowed to increase
linearly to +300 ms between 200 Hz and 63 Hz. C5 - Amplifier power to obtain Reference Level Lr(1W) = Ls - 20 log(xr) [dB SPL] (12) If the listening distance xl is greater than xr, then the amplifier power in dBW is Pref = Lref - {Ls - 20 log(xr)} [dBW] for xl > xr (13) Example 3 Monopole: Dipole: With a suggested 20 dB of SPL (= 100 x power) headroom over reference level the monopole requires 40 W and the dipole 130 W to set up a 105 dB SPL reverberant sound field. The dipole's direct sound, though, is 4.8 dB higher than the monopole's and will be 105 - 20 log(3/1.8) = 100.6 dB SPL at 3 m distance. The increased clarity could be traded off for a more lively room with larger T60 and the same 40 W amplifier power and direct-to-reverberant SPL ratio as for the monopole. C6 - Room response time Trise = 0.32 T60 [s] (14) You can think of Trise as the time constant of the room. If music or speech varies faster than the time constant, then the room will not respond fully and you hear predominantly the direct sound from the speaker. For 630 ms reverberation time and 200 ms rise time this covers modulation envelopes of a sound down to 1/200ms = 5 Hz which, in my opinion, is preferable over the 10 Hz envelope rate of a T60 = 300 ms room. In all practical cases the room response time is large
compared to the time it takes a reflected sound to reach the listener and
therefore reflections will not be masked by the reverberant field. Depending
upon the directivity of the source and the proximity of reflecting surfaces and
objects specific absorptive or diffusive treatment may become necessary.
It should not be overdone, though, because a certain amount of lateral
reflection is subjectively desirable to not destroy the impression of a real
space.
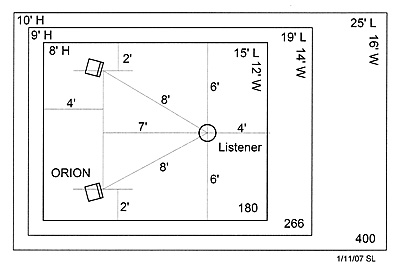
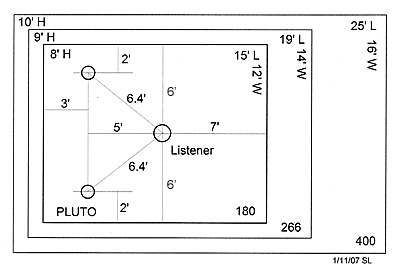
D - Loudspeaker and listener placementIt is often assumed that a study of room acoustics can lead to highly specific loudspeaker and listener placement locations, down to within an inch. Other proponents are not as optimistic and recommend a 1/3rd rule (FAQ31). I have come to the conclusion that real rooms are acoustically far too complex to predict the transmission of sound from speaker to listener, where the sound paths are in three dimensions, have direction and frequency dependent attenuation and diffusion, and can excite the inherent resonance modes of a room to unknown degrees. From practical experience I recommend the following setups as starting points. They are for ORION, a dipole or bi-directional loudspeaker, and for PLUTO, a monopole or omni-directional speaker. Three room sizes are considered. The 180 ft2 (17 m2) room with 8 ft (2.4 m) ceiling would seem like the absolute minimum for quality sound reproduction with the ORION. A 400 ft2 (37 m2) or larger room with 10' (3 m) ceiling should be perfect. D1 - Dipole setup
D2 - Monopole setup
D3 - Pink noise test Listening to pink noise is a revealing test of electrical and acoustic performance of any system setup. Pink noise must emanate from both speakers simultaneously in dual mono fashion. A tightly confined phantom image should be heard half-way between the two loudspeakers. As you move your head left or right the sound should become brighter sounding and increasingly so with about a 2 inch (5 cm) periodicity as the lateral head displacement is increased in D1. The image also becomes significantly more diffuse and moves towards the nearest speaker. Pink noise should sound neutral and uncolored, though what that exactly means is hard to define. Moving around in the room the character of the noise sound should not change significantly with speakers like ORION and PLUTO, holding up even when you leave the room and listen from outside. This is not the case with loudspeakers that have a greatly varying polar response. Listening to pink noise does not give a reliable indication of system performance at frequencies below 100 Hz and above 10 kHz. Even when pink noise is measured in 1/3rd-octave bands, the response graph is not a reliable indicator of speaker performance and should not be used as the basis for equalization. It seems so obvious that one only needs to have a flat frequency response at the listening position and be done. But, room response equalization is a very complex subject because it deals with sound in three dimensions of space, with time, with frequency, and with a highly evolved auditory stimulus processor between the two ears that is not easily fooled long-term. The response should not be optimized merely at the listening position. Few commercial products deal with this adequately. D4 - Room analysis The modes1.xls spreadsheet that was discussed under C above can be used to analyze the three hypothetical rooms and to gain some general insights. Depending upon their structural rigidity, their wall surface textures, floors, floor coverings and objects in different locations, each room will have its own unique acoustic signature. Broadly speaking, a room may sound live or dead. The extremes of this would be an unfurnished room with hard walls versus a cocktail lounge full of overstuffed armchairs and soft leather. Neither one would be suited for sound reproduction. The descriptive parameter is the average absorption coefficient of all surfaces and leakage paths. By definition an open window has a 100% absorption coefficient and if that open window covered 20% of a room's total surface area, then the average absorption coefficient for the room would be 20%. For the 180 ft2 room example this would be an open window of 169 ft2 area out of a total surface of 847 ft2. Since we usually listen with closed windows and very few surfaces have 100% absorption, it takes much more than 169 ft2 to obtain an overall 20% absorption. D5 - Lively rooms
D6 - Fairly dead rooms
The numbers in tables D5 and D6 are for hypothetical rooms and based on a very simple rigid rectangular room model. Though the numbers look precise they should only be taken as trend indicators. Note the relatively narrow range from 99 Hz to 200 Hz covered by the Schroeder frequency for the different rooms and absorptions. Below this frequency specific room modes can dominate, down to the 1st mode. Above that frequency the mode density becomes so high that a room is better described statistically by its reverberation time. For the typical home listening rooms with relatively large objects and different materials in them, reverberation time usually changes with frequency regions and is not as solid a descriptor as for concert halls. Below the first room mode the sound level becomes independent of location in the room and is a function of the lumped mechanical properties of the room. Similar to the modal region the level can be attenuated or amplified depending on wall surface flexures and leaky openings. The room adds to and subtracts from the loudspeaker's direct sound to varying degrees and in a very complex manner over the whole frequency range of the speaker. Thus the tables can only show trends above the Schroeder frequency. It can be seen in D5 that the reverberant SPL in the 400 ft2 room is 3.1 dB below that of the 180 ft2 room and when the absorption is increased to 40% in D6, it drops by another 3 dB for the same direct sound level. Since we judge loudness by the reverberant sound field this means that the volume control setting has to be increased 3.1 dB for the volume in the 400 ft2 room to be as loud as in the 180 ft2 room in D5, and by 6.1 dB for the more absorptive room in D6. Still, this is not much of an increase between the small and the large room. It confirms that ORION and PLUTO can be used in a wide range of room sizes, if volume levels are set for critical listening in the triangle seat and not for sound reinforcement at a large party. Under D6 the ratio of direct to reverberant sound level is 3 dB better than for the more lively rooms under D5 with half the absorption. These numbers are for the dipole which inherently is 4.8 dB (3x) better than a monopole. But the monopole in D2 is closer to the listener than the dipole in D1. Thus, in all cases the direct-to-reverberant sound ratio for this monopole at 6.4' (1.92 m) listening distance is only 2.8 dB worse than that for the dipole at 8' (2.4 m). Despite the poorer signal-to-reverberant ratio I find more lively rooms preferable for music and voice reproduction. Home Theater installers, though, try to get rooms down to the 200 ms T60 region, which is difficult to accomplish for low frequencies. Reverberation time of a listening room can be measured
rather easily with the NTI
Acoustilizer, but a loud hand clap can tell already whether a room is live
or dead. Rather than special products for acoustic treatment of a room I prefer
the normal stuff of life - books, curtains, pictures, rugs, wall hangings,
shelves, cabinets, chairs, sofas, etc. - to establish the acoustics of my living
spaces. ORION and PLUTO+ are well adapted to such spaces which also convey a
friendly atmosphere to most people. See also the WATSON - Stereo Enhancement Loudspeakers as a merging of room acoustics and auditory perception
|
|
| ||||

