Issues in loudspeaker design - 1
| Page 1 | Page 2
|
Page 3 | Page 4 | Page
5 | Page
6 | Page 7
|
-----------------------------------------------------------------------------------------------------------------------------------------------------------------
Introduction & Content
When it comes to the practical requirements for accurate
sound reproduction, then there are a surprising number of issues that are not
fully understood. Sound reproduction is about creating illusions in our mind, in
that amazing information processor between our two ears. Sound reproduction
involves physical processes to generate air vibrations that move our
eardrums and in turn stimulate mental processes, that have evolved over millions of
years for the purpose of survival and for communication, processes that lead to
perception of the sound source and its environment. While we can measure many
different physical parameters involved in the generation and propagation of a
sound field, it becomes exceedingly difficult to assess their relative
importance to what we hear and how it helps or detracts from the illusion.
The published scientific material on the psychology of hearing (psychoacoustics) is extensive and sometimes
helpful in explaining phenomena in two-channel and surround sound
reproduction.
In the following I describe what I see as frontiers, if
not in yours, then at least in my understanding of what matters for accurate
sound reproduction. While I strive as an engineer to
find answers and explanations based on the physics of the situation, I try to be
honest to my listening observations as ultimate arbiter. I use my memory of un-amplified sound as
reference for judging accuracy of the illusion. What I see as frontiers
may be settled areas to others, or clear separations between opposing camps,
that hold on to cherished convictions. I would hope that the exposé stimulates
a few readers to research a subject further and share their insights.
A - Acoustic absorption and acoustic resistors
B - Frequency response of open baffles
C - Dipoles below the Schroeder frequency
of a room
D - Room and baffle reflections
E - Line sources
F - Group delay and transient response
G - Multitone distortion
H - Suggestions and hearing
I - Digital crossovers
J - Doppler distortion
K - Room response equalization
L - H-frame and U-frame open-baffle
woofers
M - Investigation of energy storage
N - Mounting a driver to a baffle
O - Unreasonably high
distortion in midrange drivers?
P - Estimate of Le(x)
induced distortion at high frequencies
Q - Estimate of Le(i)
induced distortion at high frequencies
R
- Recommended study material about distortion in loudspeaker drivers
S - Dipole
and monopole woofer response
T - Separate
woofer crossover and offset
U - Woofer
level setting
V - Crossover topology
issues
W
- Accurate performance of a stereo sound system
X - Spatial
distortion in audio
Y - Triggered
burst measurements of tweeters
Z - Accuracy, spatial distortion and
plausibility of the auditory scene
A2 - High -frequency down-shelving for ORION-3
B2 - What is the optimum
polar response for a loudspeaker?
C2 - L-07 Dipole
loudspeaker
D2 - Phase shift due to
dipole D and its effect upon crossovers
E2 - Sound
field control
F2 - Woofer equalization
in LXmini
G2 - Power amplifier distortion at 1 W
& 100 mW output
--------------------------------------------------------------------------
A - Acoustic absorption and acoustic resistors
When a speaker driver is mounted in a box it radiates as much energy into the space in front of the cone as it does
into the much smaller space behind the cone. What happens to the air borne
energy inside? At long wavelengths it is common practice to store it in resonant
structures to extend the steady-state low frequency response of the speaker. In
general, the energy leads to very high sound pressures inside the box. A
small amount of the energy is lost as heat in the stuffing material, some in the
process of flexing the cabinet walls. Much of it reappears outside the box,
because the thin cone presents a weak sound barrier. Just how much is difficult
to measure, but it is a contributor to the frequency response. I am of the
opinion that the effect is most notable in the low hundreds of Hz region, where
stuffing materials are ineffective and the internal dimensions not small enough
for the internal air volume to act as a pure compliance. Consequently,
enclosures should be either very small (less than 1/16th of a wavelength) or
extremely large, both of which are not very practical for different reasons.
To make progress with box speakers an
acoustic resistor is needed that can more effectively dissipate energy in the 80
Hz to 800 Hz frequency range at high volume velocities. Such device would not
only be useful for closed box speakers, but also for speakers that use the rear
radiation from the driver to form a specific polar radiation pattern, such as a
cardioid.
A cardioid speaker can be made with two opposite polarity monopole sources
separated by a distance D, and with the signal to one of the sources delayed by
a time T = D/c. An implementation of this concept could be a driver in a box of
depth D where the rear wall is an acoustic resistor R. At long wavelengths the
box internal air volume behaves as a compliance or acoustic capacitor C. The
acoustic output from the rear of the box is low-passed by the RC filter and
delayed relative to the front output by T = RC.
The acoustic resistor should be purely
dissipative, with vanishing reactive component, and be independent of frequency.
It also should be linear over the range of volume velocities encountered for
high SPL. Traditionally cloth type materials have been used for cardioid
speakers. Long fiber wool, synthetic fibers or fiber glass matting have
been used to attenuate sound inside enclosures. The properties of these
materials are neither frequency independent nor linear.
It may not be widely known that filter media
for the filtration of liquids and gases in the chemical and other industries can
have applications in acoustics. Such filters may be thin sheets (<1 mm thick)
of a non-woven, sintered, stainless steel fibre
matrix for filtration levels from 5 to 50 micron. Airflow at a constant
velocity v through the filter material causes a pressure drop Dp
between input and output sides corresponding to a flow resistance Rf
= Dp/v [Ns/m3].
It is common in this industry to specify an inverse quantity which is
Permeability P [l/dm3/min] at 200 Pa pressure drop. Flow resistance
and permeability are related by Rf = 1200/P in this case.
Resistance values between 150 and 3500 Ns/m3, or 15 to 350 rayl in
the older cgs system of units (1 rayl = 10 Ns/m3), are obtainable
from a single filter sheet. For comparison the free-space acoustic field
impedance p/v = rc is
resistive and has a value of 414 Ns/m3 =
41.4 rayl.
Materials are available with greater structural rigidity such as Feltmetal
with thickness up to 6 mm and resistance between 6 and 50 rayl. The impedance is
resistive and constant over the 20 Hz to 2 kHz range that I tested. Linearity
should also be quite good, but I have not measured it.
The challenge remains to build an acoustic
termination for the inside of a box. Feltmetal and filters should be readily
useable for a cardioid speaker, but for a woofer application their linearity at
high volume velocities needs investigation.
Top
B - Frequency response of open baffles
At this point in time the design of an
open baffle speaker using cone type drivers is highly empirical. The baffle
shape which determines the on-axis and off-axis frequency response must be optimized
by experiment. This is how the dimensions of the PHOENIX main panel were
determined (Ref.2), because no modeling software
was available. Some guidance for baffle size can be derived from the response of
a flat, thin circular disk baffle
of radius D with the driver in its center. This shape is less than optimum for
use at frequencies above f = 0.5 c/D, where comb filtering occurs. The peaks and
dips in response are smoothed by a flat rectangular baffle.
As the driver itself becomes more directional the outline of the baffle has less
effect.
For size, appearance and structural
reasons the baffle may be folded back into a shallow U-shape.
At low frequencies the H-shape and W-shape
baffles lead to space savings. All of theses structures are considerably more
difficult to analyze, because lumped and distributed acoustic elements have been
added in the process of folding.
The radiation of the driver itself to
front and rear is not symmetrical. The basket structure
adds a complicated acoustic lowpass filter. This affects not only the output to
the rear of an open baffle, but also the response in front due to additional
phase shift and change in amplitude.
While it is not too difficult to estimate
the response of H and W baffle structures at long wavelengths, it would be
highly desirable to have modeling software for flat and U-shaped baffles for the
whole frequency range. To be of usefulness the software would have to account
for the measured frequency response of the driver in an 'infinite' size baffle,
for radiation in front and rear and at different angles.
Top
C - Dipoles below the Schroeder frequency
of a room
The Schroeder frequency
describes the approximate border between the frequency range of discrete, sparse
room mode distribution below it and high mode density above it.
fs = 2000 ( T60 / V )1/2
[Hz, s, m3]
For typical domestic listening rooms fs is in the order of 100 - 200
Hz.
Above fs a dipole source is in the reverberant
field and has the following behavior:
- 1/3rd or -4.8 dB of the radiated acoustic power
compared to a monopole for the same direct sound pressure level, due to the
cos(angle) free-space polar pattern.
- A 4.8 dB higher level of direct to reverberant sound
compared to a monopole.
- Rotation of the source affects the direct sound level,
but this is strongly masked, because of the typically higher reverberant
sound level.
- Room placement and rotation have little practical
effect upon the reverberant sound field level. The number of possible modes
is so high, that reducing the excitation of some increases it for
others.
- Reflections are affected by placement and rotation.
Below fs in the sparse mode region:
- Fewer modes are excited compared to a monopole, because
of the cos(angle) directivity.
- A monopole and a dipole source in the same location
will excite a given mode to a different degree, because their source
impedances are very different. Consequently, the match to the acoustic field
impedance of the mode is different.
- Monopole and dipole source in the same location will
excite a given mode to a different degree for an additional reason. For
maximum excitation by a dipole source the direction of mode propagation has
to coincide with the free-space direction of maximum source radiation.
The observed audible difference between monopole and
dipole for bass below fs is:
- Less boom and droning of specific notes with a dipole,
- A higher degree of articulation and resolution of
complex musical bass lines,
- A sense of air, spaciousness, and very natural
reproduction of acoustic bass,
- Less physical impact,
- Less absolute bottom foundation below the lowest room
mode frequency.
To my knowledge these and similar subjective observations
have not been explained satisfactorily by theory and only partially by
measurement. In Ref.1 I have investigated dipole
behavior on the basis of:
- Steady-state frequency response of the transfer
function between source and listener for a simple 2-dimensional model and
measurements in a very small office room and a living room,
- Cumulative spectral decay measurements,
- Energy-time curve of the low frequency impulse
response,
- Modulation transfer function for low frequencies,
- Frequency response to shaped tonebursts,
- Frequency and time response to a multi-burst signal and
its correlation to listening impression.
The best physical evidence for dipole benefits, that I
have found, comes from multi-burst
tests. A CD with such test signals is
available.
The steady-state frequency response has been used for
arguments pro and con dipole low frequency sources. While the transfer functions
for dipole and monopole are clearly different I would not dare to make sound
quality judgments based either on the data that I have seen or the ones I have
taken myself. The exception to this is the very low frequency region,
below the first mode, where the monopole response gains consistently from
pressure buildup compared to a dipole.
I suspect that the perceived low frequency benefits of
dipoles are related to the psychology of hearing and involve much more complex
processes than a simple steady-state response analysis. Our mind is geared
towards analyzing time, frequency and amplitude variant sound pressure between
two ears and selectively draws information from it.
My hypothesis is that three effects contribute to the
subjectively more accurate reproduction of bass:
1 - The open baffle, dipole woofer has a figure-of-eight radiation pattern and
therefore excites fewer room modes.
2 - Its total radiated power is 4.8 dB less than that of a monopole woofer for the same
on-axis SPL. Thus the strength of the excited modes is less.
3 - A 4.8 dB difference in SPL at low frequencies is quite significant, due to
the bunching of the equal loudness contours at low frequencies, and corresponds
to a 10 dB difference in loudness at 1 kHz.
Thus, bass reproduced by a dipole would be less masked by the room, since a
dipole excites fewer modes, and to a lesser degree, and since the perceived
difference between direct sound and room contribution is magnified by a
psychoacoustic effect.
Top
D - Room and baffle reflections
Reflections are part of everyday life. If you have been
inside an anechoic chamber and experienced the eerie silence and feeling of
disorientation, then you know what I mean. In more common surroundings, every
sound we make generates a set of reflections. If the sound is sustained, then
its amplitude and phase at a given location are affected by the surroundings.
This is what happens in a listening room. To quote:
"The acoustics of a room resemble either a linear filter or a hall of
mirrors, depending upon the time scale of interest. As a filter, a room causes
linear distortion in the amplitudes and phases of steady-state tones received by
the listener's ears. As a hall of mirrors, a room appears to be a collection of
spatially distributed reflecting surfaces that create multiple versions of each
transient sound. The reflected transients ultimately reach the listener from
diverse directions, almost none of which agree with the direction of the source.
Thus, both the steady-state and the transient response of a room result in the
listener receiving misleading cues about the location of a source of sound in
the room." [1]
Modeling and understanding of how we manage to cope with this situation, and
actually localize real and virtual sources surprisingly well in most instances,
is subject of ongoing scientific investigation [2]. Inter-aural
time delay (ITD), and intensity differences (IID), spectral envelope cues, and
the "precedence effect", all play their part in recognizing the
location of sources when room reflections are present. In addition to affecting
localization: "The lagging sounds can contribute markedly to perceived
timbre and to the sense of a room's acoustics. If the acoustical features of the
lagging sounds are consistent with them being echoes of the leading sound, then
the lagging sounds are perceptually suppressed, and are not heard as separate
auditory events. On the other hand, if the lagging sounds cannot be plausibly
interpreted as echoes, or if insufficient information is available to decide
whether they are echoes or not, then they will tend to be heard as separate
auditory events." [2]
Most of the research into audibility of reflections has
been performed under anechoic conditions. Detection thresholds and phantom image
shifts for a single reflection versus delay time and amplitude have been studied
extensively. But, the results cannot necessarily be translated to binaural
listening in reverberant spaces. Nevertheless, the prevailing school of thought amongst audiophiles holds
all reflections to be detrimental. The prescription is to either absorb or
diffuse reflections as much as possible. A room with only hard reflective
surfaces and with no furnishings, having echoes and long reverberation time, is
clearly not an ideal playback environment, but nor is an overstuffed room, full
of absorbing materials and resembling an anechoic chamber. The ideal room may be
a function of the type of speaker used.
The typical, conventional box speaker has a power response that decreases over
10 dB from low to high frequencies, assuming a flat on-axis response. It is
omni-directional up to a few hundred Hz and becomes ever more forward radiating
with increasing frequency. An open baffle, dipole speaker has at least 5 dB less
power response variation between low and high frequencies. While box speakers
seem to perform best in relatively dead rooms, I have found that dipole speakers
show their qualities better in a rather live room.
In general, the more a room resembles an anechoic chamber,
the less the off-axis radiation contributes to the sound at the listening place.
The type of dipole speakers I have worked on, all try to duplicate the on-axis
response for off-axis horizontal angles up to +/-60 degrees, albeit at
decreasing levels and up to about 5 kHz. This has two effects. The level of the
reflected sound is angle dependent and can be reduced by speaker orientation.
The acoustic features of the reflected sound are consistent with the direct
sound. Both of these help in suppressing a perception of timbre change and
decrease a sense of the room's acoustics. Consequently, you hear more of the
speaker and less of the room.
Much has been made about the wall behind an open baffle
speaker, the front wall from the listeners perspective. The wall reflects the
rearwards radiated sound which is 180 degrees out-of-phase with the forward
radiated sound. The interference between the two leads to progressive
cancellation at low frequencies and comb filtering at higher frequencies for
steady-state sounds. A corresponding effect occurs with a box speaker, at least
up to several hundred Hz, only the comb filter frequencies are different and the
low frequencies are boosted. All of this is controlled by the distance between
speaker and wall. If the speaker is at least 1 m (3 ft) in front of the wall,
then the reflected sound is delayed by about 6 ms, which is sufficient not to be
perceptually summed with the direct sound. The cognitive process disassociates
it from the speaker and attributes it to the room with a sense of space.
Panel type open baffle speakers can have specific problems with the back wall.
The radiation impedance seen by the panel goes to extreme values at frequencies
where the distance is a multiple of a quarter wavelength. The motion amplitude
of the very low mass panel may change due to the change in air load, causing a
change in frequency response. Also, a large panel area creates a lobing polar
response at higher frequencies and the reflection can become colored in timbre,
shift angle and cause unstable imaging.
I have observed that a certain amount of lateral
reflection is necessary for creating a believable illusion of the space in which
the recording took place or to give a satisfyingly rich musical experience [3,4,5].
Flush (soffit) mounted speakers strike me as producing a sound that is
two-dimensional, analytical, but ultimately lifeless. Highly directional horn
speakers create a similar negative impression. In the tweeter range, wide
horizontal dispersion removes harshness and adds airy-ness in my experience.
This only makes sense if the reflected sound intensity has been increased. It
might also explain why ribbon tweeters, which can be very narrow sources leading
to wide dispersion, are so highly regarded, despite their poor vertical polar
response.
RT60 for my listening room
is around 550 ms and pleasantly lively for conversation and socializing. I do
not like a muffled cocktail lounge ambience. The two side walls are mostly
double pane glass. The room is very long. A large brick fire place is 1.5 m (5
ft) behind the speakers. Imaging is very precise, given a good recording, with a
smooth spread of the venue acoustics between the speakers and slightly beyond.
The images are placed behind the plane of the speakers, never in front. The
speakers disappear completely.
Sound diffraction at the edge of a box speaker baffle is
claimed to degrade stereo imaging. I have not experienced this myself for
speakers with typical flat baffles for drivers up to 8" (20 cm), nor have I
seen scientific evidence. The low amplitude diffracted sound wave occurs so
early after the direct sound (<500 us), that the precedence effect does not
come into play and summing localization occurs [6]. What is significant,
is that the "baffle step", the transition from 4p
to 2p-space radiation,
occurs at higher frequency for a narrower baffle. This keeps the power response
more uniform over a wider frequency range and the spectral signature of any
reflection more like the on-axis response. Large radius or wide chamfered
edges smooth the high frequency response on-axis and off-axis.
The question remains: When is room treatment necessary and
for what purpose?
Specular reflections [7] can be diffused with quadratic residue diffusor
panels, but this will not change the reverberant sound energy in the room.
Diffusors become very large for frequencies below 500 Hz. Reflections can also
be absorbed. This too works best above 500 Hz. Treatment for lower frequencies
becomes exceedingly more space consuming and below 100 Hz requires custom
solutions.
[1] William M. Hartmann, "Auditory localization in
rooms", Proc. AES 12th International Conf., Copenhagen, 1993, "The
perception of reproduced sound", pp. 34-39
[2] Brian C.J. Moore, "Controversies and mysteries in spatial
hearing", Proc. AES 16th International Conf., Rovaniemi, 1999,
"Spatial sound reproduction", pp. 249-258
[3] Arthur H. Benade, "From instrument to ear in a room: Direct or
via recording", JAES, vol. 33, no. 4, 1985 April
[4] David Moulton, "The creation of musical sounds for playback through
loudspeakers", Proc. AES 8th International Conf., Washington, 1990,
"The sound of audio", p. 167
[5] https://www.sawonline.com/wp_mix_article1.html
[6] Jens Blauert, "Spatial hearing. The psychophysics of human sound
localization", MIT Press, 1997
[7] James A. S. Angus, "The effects of specular versus diffuse
reflections on the frequency response at the listener", JAES, vol. 39, no.
3, 2001 March
Top
E - Line sources
As a line source I define a speaker with a very narrow and
long radiating surface, which is used at frequencies above f = c/2L, where its
length L is greater than 1/2 wavelengths. Often such line source consists of a
vertical array of a large number of identical drivers on a narrow baffle. In
other cases it might be a ribbon like, narrow and long conductor in a magnetic field, or a
narrow and tall electrostatic source. Specifically, I am referring to lines that
are at least 1.5 m (5ft) long.
Under free-field conditions such lines will have a wide
and fairly uniform horizontal radiation pattern The vertical polar
response will be very irregular and highly distance dependent, because of the
finite length of the source [1]. In a room, though, the images of the
source in floor and ceiling will make it appear as infinitely long, the more so,
the less the gaps between the ends of the source and the reflecting floor and
ceiling surfaces. Consequently, the line launches a cylindrical wave and
illuminates the room very uniformly. The acoustics of
the room, therefore, are of similar importance as for an omni-directional point
source. At sufficient distance the direct SPL falls off with the square root of distance, which
improves the
direct-to-reverberant sound ratio over that of a point source.
It
surprises me that in a reverberant environment, such as a typical living room,
these radiators give little indication of poor vertical polar behavior, even
when the line does not fully extend to floor and ceiling. Clearly, the
reverberant field in the room fills in any perceptual notches in the polar
response. Standing close to the line and moving with one's ears up and down, the acoustic image
does not change and follows the ear over the active length of the line, almost
to its ends. Imaging is very precise, when standing or seated in the near-field
of the line, which is closer than the typical listening distance given by the
apex of an equilateral triangle. At greater distances the images grow in height.
This can be impressive on big orchestral pieces, as if looking through a large
window onto the sound stage. Small acoustic sources, like a vocalist or a cello,
though, become overblown in size. Line source speakers are at their best when
listened to close-up like giant headphones. This preserves proper size imaging
and gives the illusion of a large sound stage.
Vertical height of the sound stage adds to its realism. I find
small 2-way speakers very unsatisfactory in this respect, even when they are
correctly positioned at ear level height. Line sources provide this height, as
do single tweeter symmetric driver layouts like LM-UM-T-UM-LM. In the latter case
separate frequency ranges are assigned to each symmetrical set of drivers LM-LM
and UM-UM, such that any free-space vertical lobing is minimized. This type of
source suffers considerably less from the image size distortion of a uniform
line.
An added advantage of
tall sources is their relatively large radiating surface area, which means small
excursions and, therefore, progressively lower non-linear distortion for a given maximum sound
level. The low distortion aspect is even more important, than sound stage
height, wide angle horizontal dispersion and uniform power response. Low distortion means
increased dynamics and clarity, and the ability to play back at near live levels
without listener strain. It brings the naturally occurring distortion mechanisms
of the ear into play, which are necessary elements for creating an illusion of
reality.
Sensitivity can be high. A line with 25 identical drivers connected in series-parallel
to obtain the same combined impedance as that of a single driver, will have 14
dB higher SPL for the same voltage applied.
Stored energy is not necessarily
low because of the many cabinet and driver chassis cavities.
I would encourage more investigation of line sources for
use in very large venues, as for public address or entertainment speakers. For
typical domestic environments they are unnecessarily large. Today, the same low
distortion sound pressure levels can be obtained from far fewer drivers and
without the image distortion.
[1] Stanley P. Lipshitz, John Vanderkooy, "The
acoustic radiation of line sources of finite length", 81st AES Convention,
Los Angeles, 1986, Preprint 2417
Top
F - Group delay and transient response
Few studies have been made about the audibility of linear
distortion of the time waveform for an acoustic signal. Some people have great
expectations about the improvements that DSP technology can bring to
loudspeakers and crossovers through linearizing their phase response, which
should result in a perfect transient response. The step response fidelity is
often taken as a measure of performance. The step response is the integral of
the impulse response over time, and belongs to a frequency response, that has
been rolled off at 6 dB/oct towards high frequencies, starting from zero
frequency.
It is instructive to review the step response of a
practical 3-way speaker and to compare it to a full-range speaker. Both speakers
are assumed to have a flat frequency response that is 3 dB down at 20 Hz and 20
kHz, rolling off at 12 dB/oct like a filter with Q = 0.7. The 3-way speaker has
LR4 crossovers at 100 Hz and 2 kHz as in graph (a).
The step response of the full-range speaker FR is far from
perfect, because the loudspeaker is a bandpass and in this view (b), over a 60
ms time window, the low frequency highpass dominates the shape of the curve. At
time Tx the response crosses the zero axis. The positive area under the curve
between zero and Tx equals the negative area between Tx and very large time,
because a bandpass system cannot pass dc. Equivalently, a speaker cannot set up
a permanent pressure increase, as would be required for perfect step response.
DSP based equalization can move Tx out in time, but how
far is enough needs to be established. The aural integration time window is
about 50 ms, before echoes are noted.
The step response of the 3-way looks even further removed from the ideal and it
is easy to understand why people like to think this should be accompanied by
audible defects. The response is the sum of woofer, midrange and tweeter outputs
(c). The tweeter response, barely visible on the 60 ms time scale, really shows
up in a display of the first 5 ms (d).
Note that the tweeter response has settled in 1 ms. The
midrange has its second zero crossing at 4 ms. The woofer has barely started to
move after 2 ms. A time window of 5 ms or less is frequently used in speaker
reviews to comment about driver polarities and waveform preservation (e). This
covers less than 10% of the transient response time for many speakers.
A recent audiophile magazine review of a 3-way speaker,
with response similar to (e) above claimed: "... The step response
indicates that the tweeter and midrange unit are connected with positive
acoustic polarity (the sharp up/down spike at 0 ms and the lazier triangle 0.4
ms later), while the woofer is connected with negative polarity (the broad,
negative-going hump centered between 1.5 and 2.5 ms). The actual drive-unit
polarity doesn't matter except when it comes to waveform preservation -- and the
jury is out on that subject."
More understanding of the subject matter is obviously needed.
The phase of a speaker's frequency response has to change
linearly with frequency in order to preserve waveform fidelity. This is
equivalent to saying, the group delay has to be constant (f).
Group delay increases dramatically at low frequencies,
even for the full-range speaker. To equalize the 3-way speaker down to 50 Hz a
great amount of delay would have to be added to the higher frequency portion of
the spectrum. This is practically impossible to accomplish with analog means and
not completely trivial with DSP either.
If delay equalization is restricted to higher frequencies,
where digital processing becomes easier because of shorter time record lengths,
then large portions of the spectrum remain distorted (g). Such solution may
improve the first few milliseconds of the step response, but it remains to be
shown unambiguously that if this is audibly noticeable. It will enable
fairly accurate reproduction of square-waves with frequencies above 1 kHz
though.
With similar effort a 2-way speaker could be delay
equalized over a wider frequency range. A 2-way loudspeaker is either marginal
in frequency coverage or in dynamic range and improvements in its transient
response might be easily masked by other shortcomings. A full-range or single
driver speaker is even more limited and not a
contender, except in the form of headphones.
I have used headphones to convince myself that the phase distortion introduced
by LR4 crossovers around 2 kHz and at 100
Hz are not audible. For example, a 1.5 kHz LR4 crossover with 24 dB/oct
slopes forms a second order allpass filter with Q0 = 0.7 for its pole and zero
locations.
Its non-linear phase shift and non-constant group delay in
the crossover region cause waveform distortion which is not audible, though.
If the allpass Q0 is significantly higher, like Q0 = 2.5,
then the phase distortion does become audible. In the case of the 100 Hz
square-wave a high pitched sound is added. The
frequency response, though, is completely flat.
I am not certain what happens in the range below 100 Hz
and I have strong suspicions that this is the region where delay distortion is
audible. It is also the region where delay really accumulates via vented and
bandpass woofers, and the great numbers of dc blocking capacitors in the signal
chain from microphone to speaker terminal.
Further experiments might be performed with a high quality
3-way speaker system, whose phase response or group delay have been carefully
measured or modeled. Knowing the phase distortion, which the speaker will
introduce, use digital signal processing with the appropriate software to
pre-distort various music files on a PC, such that the overall playback phase
response will be linearized. Burn the newly created files to CD-R. For
comparison take the same music files and add a constant delay to them, so that
pre-distorted and un-distorted material have undergone the same process and any
artifacts are common to both. In this way one could switch directly between
nearly identical tracks of a CD-R and listen for differences that can only be
the result of phase response differences.
Bohdan Raczynski compiled "Some
Attributes of Linear-Phase Loudspeakers", which points to the
mechanisms by which we recognize the direction to a source and its size (Fig.
3).
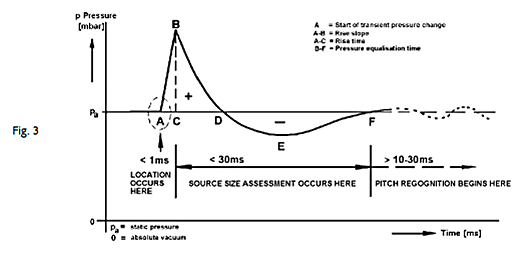
Compare the time scale to Figures (b) and (e) above
for a 3-way loudspeaker to note to which degree it distorts the wave form in the
location determining and size assessment time frames. Is that audibly
significant?
It makes sense to me that bass from a linear-phase speaker sounds different.
Group delay at the low end does seem to matter.
Vented versus sealed box bass certainly sounds different. Transients in the
range above 2 kHz, in the ILD range of hearing, are used for location determination,
but also signal arrival time differences in the ITD range below 800 Hz. The
stereo phantom scene, the mental illusion derived from cues in left and right
loudspeaker signals and often masked by the room's response to them, could
therefore be affected in terms of its spatial aspects and clarity, but less in
terms of timbre. The high degree of spatial distortion in headphone rendering
would invalidate linear-phase listening
tests using them. I suspect that "hearing absolute polarity" is a
low frequency phenomenon, differentiating between the polarity of the doublet
wave form during rapid compression/rarification and its opposite polarity during
much slower relaxation. I doubt that one can hear the polarity of a high
frequency "click". But I have been told that it can sound like
"clack" when phase distorted.
Today it is not that impractical anymore to linearize the overall phase response
of a speaker using DSP and to hear the results. As with all listening the
experience is subjective and its validity can only be confirmed by comparison to
the sound of real sources.
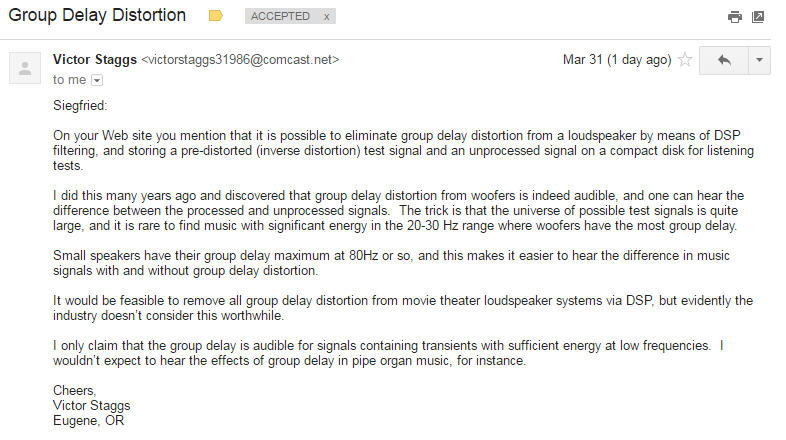
Victor Staggs wrote to me about group
delay distortion effects at the low end of a
loudspeaker's frequency response:
"... I only claim that the group delay is audible for
signals containing transients with sufficient energy at low frequencies. I
wouldn’t expect to hear the effects of group delay in pipe organ music, for
instance."
 I agree.
Top
G - Multitone distortion
The measurement of harmonic distortion gives an incomplete
description of the non-linear behavior of a loudspeaker, even when the exciting
sinewave is swept to generate a continuous display of distortion products. Still, it is very useful data for comparing devices.
More information is obtained when two tones are used,
because now also the various sum and difference products of the two stimuli and
their harmonics can be measured with a spectrum analyzer. These intermodulation
products are usually higher in amplitude than the related harmonic distortion
products. I cannot emphasize enough, that anytime when a device introduces
harmonic distortion, it will generate intermodulation distortion, when more than
one tone is involved. Some seem to think that a little bit of 2nd harmonic
distortion, as often generated by tube equipment, has a pleasing effect, because
it enriches the natural even harmonics of acoustic instruments. It will also
generate non-harmonic intermodulation, and has little to do with accurate sound
reproduction or even generating the illusion of a real sound. Instead it imparts
a euphonic sameness to all sounds.
Real sounds contain many tones. A woofer might be tested
with a set of 5 tones that are not harmonically related, such as 20, 28, 44, 64,
and 92 Hz, but which cover the woofer's intended operating range. Each of the
tones is a multiple of 4 Hz, with factors 5, 7, 11, 16, 23, and the resulting
distortion products will occur at 4 Hz intervals.
The richer distortion spectrum makes comparison
between devices easier than relying on the few data points that harmonic
distortion provides. The time waveform for the sum of the 5 tones looks very
erratic but is, of course, periodic. A very simple looking, but highly effective
test signal is a sinewave that is 100% amplitude modulated at 1/10th its
frequency. This type of stimulus is especially useful for stressing vibrating
systems and audibly detecting the onset of distortion as its amplitude is
increased. To avoid permanent damage only bursts of this signal should be used.
The undistorted spectrum consists of the carrier b and two
sidebands a, c, which are 6 dB down and offset by b/10. The potential distortion
spectrum contains harmonic and intermodulation products. A few of those are
shown below. They occur at intervals b/10.
The close-up measurement of a tweeter reveals the dense
sound spectrum generated by the cluster of 3 tones at 1.6 kHz.
I have found these and other types of multitone test
signals useful for sorting and relative ranking of
drivers. Their subjective evaluation when part of a complete speaker correlates
closely with the measurements. It should be understood that distortion has
audible effects long before it is perceived as distortion. For example, it might
enhance sonic detail, analogous to contrast enhancement in a photo.
I think a recent experience while
attending a San Francisco Symphony performance gave me further insight into why
we are able to tell a loudspeaker from a live instrument. Loudspeakers
reproduced pre-recorded material, interspersed with the musicians' playing,
during the performance of several modern pieces of music. It seemed, that coming
out of the loudspeaker a sound carried a comet like trail of newly created
sounds with it, that formed a continuum of background sounds, which was
completely absent from the live instruments and made the speaker immediately
recognizable as such. Live instruments had a space between tones, like a black
background, and even en mass always remained articulate. I believe the
observation had nothing to do with recorded ambience, which was present
occasionally, or with hall reverberance. It reminded me of other incidences,
where I had easily recognized live instruments, though there was no reflection
free path between the source and my ears, and where I then struggled to describe
to myself what would have been different, if a loudspeaker was playing instead.
It seems to me that the ongoing-ness of sound is one of the major problems with
speakers. It shows less with recordings of a single voice with small
accompaniment, so often favored by audiophiles, but in complex passages of
classical orchestral music and choral works.
Much work remains to be done before firm predictions of
sound character can be made from distortion measurements. Wolfgang Klippel
has developed a practical methodology for characterizing and auralizing the
effects of various distortion parameters in woofers at large excursions.
Researchers at Cerwin Vega have done extensive theoretical work [1]. They
concluded amongst other things: "... With an increase in the number of
tones, the multitone provides increasingly detailed information about the
nonlinear behavior of a DUT. An ultimate increase in the number of tones leads
to a noise-like signal that may hypothetically provide complete information
about a nonlinearity-impaired DUT, but demands an enormous amount of
calculation, if a high-order nonlinearity is to be assessed."
[1] Gene Czerwinski, Alexander Voishvillo, Sergei
Alexandrov, Alexander Terekhov, "Multitone testing of sound system
components - Some results and conclusions, Part 1: History and theory", JAES,
Vol. 49, No. 11, 2001 November, pp. 1011-1048.
"Part 2: Modeling and Application", JAES,
Vol. 49, No. 12, 2001 December, pp. 1181-1192.
Top
H - Suggestions and
hearing
It is common practice in promoting audio products to tell
a customer what to pay attention to in what he is going to hear, then to
follow that with a demonstration, and afterwards to tell him again what he
heard. It is the same process, whether it is a manufacturer's representative
speaking with a store sales person, or the sales person talking to a prospective
buyer. It is almost impossible for the target person not to hear, what has been
suggested they will hear.
The power of suggestion has been used to perform major
surgery without anesthesia, where the patient experiences no pain. It has been
shown with CAT scans of the brain that in such cases an information disconnect
occurs between the region that responds to pain, and the region of the brain
that gives the patient the perception of pain. Thus, the normal perception
process has been altered through the verbal, non-physical preparation that
the patient received beforehand.
The influence of suggestion, especially when frequently
repeated, should not be underestimated in the field of hearing. Many listeners
have not acquired an auditory reference that is based on un-amplified sounds and
are thus easily misled in matters of accuracy. Double-blind and ABX product
comparison tests are frowned upon in some audio circles, though they remove any
influence of suggestion, self or other generated.
I have no problem, if people enjoy their music more,
because it has passed through a certain interconnect, has been transformer
balanced, amplified without feedback, processed through a reissued WW2
transmitter tube and sent to their speakers on litz wires of specific
arrangement and purity, except that the money for these suggestions could have
been spent on better speakers, for real improvements in accuracy of dynamic
range and resolution. After all, the loudspeakers are
by far the weakest link in the chain of components that are needed for sound
reproduction.
Addendum, February 2008:
If a tree falls in the forest, does it make any sound? No, except when a person
is nearby that interprets the change in air particle movement at his/her ear
drums as sound coming from a falling tree. Perception takes place in the brain
in response to changing electrical stimuli coming from the inner ears. Patterns
are matched in the brain. If the person has never heard or seen a tree falling,
they are not likely to identify the sound. There is no memory to compare the
electrical stimuli to.
This apparently also works the other way around. If brain
connections are set up in response to suggestions or expectations, then those
will also be used to interpret incoming electrical stimuli. I am convinced that
my friend who claims he hears the difference when he first demagnetizes a CD
before playing it, he actually perceives it as such and it is reality for him. I
cannot hear it, but then I have a low expectation of hearing any effect. It does
not make sense to me that there could be a difference.
This is a tricky area for a loudspeaker designer. I
therefore try to focus on the basics of acoustic and electrical design and to
stay out of it. I try to maintain firm auditory references by refreshing them
periodically, like having season tickets for the symphony. It is easy to get
lost. High-end audio is full of gadgets and supporting theories. For some this
is the way to Nirvana. I prefer composers and performing musicians to lead me
there.
By all means read: "This Is Your Brain on Music"
by Daniel J. Levitin
Top
I - Digital crossovers
Some people think that digital crossovers will replace
analog ones, because digital filters can be designed with desirable
characteristics that are impossible to realize with analog circuitry. In
particular, lowpass and highpass filters with extremely steep slopes and linear
phase shift are possible. Steep slopes reduce the overlap region between
drivers. Linear phase shift eliminates waveform distortion and merely causes a
delay of the signal. Such characteristics can be obtained from the digital
equivalent of tapped delay line filters, which have a finite impulse response
(FIR) duration that depends upon the number of taps used. Digital FIR filters
can have almost any desired frequency response, if the number of weighted taps
is made sufficiently high. [1]
The linear phase shift comes at a price. The impulse
response rings. The more so, the steeper the filter slopes. Both lowpass and
highpass sections of the crossover ring, but when the outputs are combined, as
for a crossover, then the two impulse responses add to a non-ringing, delayed
pulse.
All would be fine, if we listened only in anechoic spaces
or to speakers with coincident drivers. In reality we use speakers in rooms with
reflections and reverberation and the the drivers are separated from each other
due to their sizes. As a consequence the off-axis response of the speaker
matters and contributes to what we hear. With the drivers non-coincident, the
lowpass and highpass outputs are delayed different amounts at points off-axis,
and the ringing is no longer canceled in the addition. In the best case the
drivers might be coaxial, but this has another set of problems. Very steep
crossovers can also cause a very abrupt change in the polar pattern of the
speaker, when transitioning from a large diameter driver to a small one. Under
reverberant conditions and/or listening off-axis this may have audible
consequences.
A different type of digital filter has an infinite impulse
response (IIR), from using recursive or feedback topologies. IIR filters can
closely simulate all the known analog filter functions, but also have their
associated non-linear phase shifts. The frequency response of a given IIR
filter, such as a biquad, can be easily changed by reprogramming its
coefficients. They are readily adapted to different needs.
Digital filters have high accuracy and are very
repeatable. They require high performance ADC, DAC and DSP. Analog
anti-aliasing and reconstruction filters are part of their design. Dynamic
range, clipping and noise must be dealt with in the digital domain of numbers.
In particular, the effects of numeric round-off upon filter shapes and
distortion must be analyzed. For reasons of limited linear digital range the
volume control must be located after the DSP to maximize bit resolution. Non-linear distortion in all its forms between input and analog output has to be
considered and minimized. Loudspeaker drivers have their own inherent acoustic
highpass amplitude and phase response, which must be accounted for in the
digital crossover filter design. Electromagnetic compatibility (EMC) should be
designed in and tested for.
[1] Steven W. Smith, "The
Scientist and Engineer's Guide to Digital Signal Processing"
Top
J - Doppler
distortion
Drivers are now available that generate very low
intermodulation distortion, because their motor behavior is very linear. This
may bring Doppler distortion to the foreground under certain conditions. Doppler
distortion occurs when two tones of largely different frequency are radiated from the
same membrane. It is a linear form of distortion, at least to the first
order, which means its magnitude is independent of the amplitude of the higher
frequency tone and distortion increases linearly with the amplitude of the lower
frequency tone..
For example, a 18 cm (6.5 inch) driver with 126 cm2
cone area like the Seas W18E001 may radiate a 50 Hz low frequency tone at 5 mm
peak excursion, which produces 86 dB SPL at 1 m. The
sinusoidal cone displacement has a peak velocity of:
Vp = 2 p
fL Xp = 1.57 m/s
A 2000 Hz tone which is radiated simultaneously will have
its wavelength shortened and lengthened at a 50 Hz rate as the cone velocity is
added to and subtracted from the speed of the sound's propagation (c = 343 m/s).
Based on a relatively simple analysis
this results in a frequency modulation of the 2000 Hz tone with a peak deviation of:
DfH = 2 p
fL fH Xp / c = 9.2 Hz
The modulation distortion can be reduced to 5.5 Hz for the
same 50 Hz SPL by using a W22EX001 driver with 220 cm2 cone area.
The audibility of Doppler distortion depends upon three
criteria:
- the FM threshold of hearing,
- masking by the low frequency tone,
- FM to AM conversion due to room resonance.
The FM threshold is typically determined at a low
modulation rate of 4 Hz and is about 0.35% for frequencies above 500 Hz,
corresponding to 7 Hz deviation at 2000 Hz. Higher modulation rates around 70 Hz
may be perceived as roughness of the tone.
Masking is dependent upon the relative levels and frequency separation of the
two tones.
A room with a reverberation time T60
= 500 ms has resonances with a 3 dB bandwidth of BW = 2.2 / T60 = 4.4
Hz. The slope of the filter curves is about 3 dB per BW/2 or 1.4 dB/Hz. Thus, a
9.2 Hz deviation of the 2000 Hz tone could generate up to 12.9 dB change in its
amplitude, if the rate was slow enough so that the sidebands of the FM signal
are not significantly attenuated by the filter.
Doppler distortion of a driver can be measured with a
spectrum analyzer by observing the amplitude of the frequency or phase modulation
sidebands As relative to the carrier AH. The relative
amplitude for the first pair of sidebands is approximately
As / AH = 0.5 DfH
/ fL = p fH
Xp / c = 0.09
or 20.7 dB below the 2000 Hz carrier AH,
regardless of fL as long as Xp = 5 mm. This
corresponds to a phase modulation with a maximum phase deviation of 2 As
/ AH = 2 x 0.09 rad = 0.18 x 180 /
p = 10.3 degree.
The sidebands occur at the same frequencies fH - fL
and fH + fL as the 2nd order intermodulation
products of the two tones. They can be differentiated by changing the applied signal levels.
Doppler sidebands decrease 3 dB for a 3 dB reduction in signal levels, whereas
2nd order intermodulation sidebands decrease 6 dB. The two sidebands may be of
different amplitude when both forms of distortion are present, because the
intermodulation products are in-phase with each other, the FM sidebands are
out-of-phase. This fact allows a decomposition of unequal sidebands into their
two constituent odd and even parts.
I have experimentally verified the results of the
above
analysis by measuring the relative amplitude of the sidebands in the frequency
spectrum. The Doppler effect is very difficult to measure in the time domain,
though, because of the small amount of phase shift (e.g. 10.3 degree) that it
causes for the higher frequency tone. Rod
Elliott claims to have been able to measure the shift in the time waveform. An analysis of his
observation confirms that the maximum phase shift occurs when the cone
is at its maximum excursion, where its velocity is zero. The
Doppler analysis usually mentions only the maximum frequency shift, which occurs
when the cone has its highest
velocity, or when going through zero excursion for a sinusoidal low frequency tone. Both results
are correct and are a consequence of the fact that the radian frequency
w = d(phase)
/ dt . This leads to a 90 degree phase shift between time varying frequency and
phase for a sinusoidal signal. Either way
of looking at the situation results in identical magnitudes of the spectral
components. It all is the Doppler effect, though I have not seen the associated
phase modulation pointed out in text books.
Top
K - Room response
equalization
In theory, digital signal processing allows to remove
completely the effect of the room upon the frequency response of a loudspeaker
at the listening position, but only over a very small region in space. The
principle is illustrated by correcting the output signal from a loudspeaker in
order to cancel the effect of the inevitable floor reflection upon the response
at the listener's place.
The model assumes a speaker with 20 Hz to 20 kHz response.
The floor is not perfectly reflecting and together with the attenuation, due to
a 32" (0.81 m) longer path length for the reflected signal (b) than the
direct signal (a), the amplitude of the reflected signal at the listener will be
half that of the direct signal. The floor reflection is delayed by 2.37 ms. The
step response at the listener position is the sum of direct and reflected
signals (c).
The frequency response at the listener position shows the
typical comb filter behavior (e). At low frequencies the floor reflection adds
to the direct sound (d). The first minimum in the response occurs when the
32" path length difference corresponds to 1/2 wavelength and causes 180
degrees of phase shift, which is at 211 Hz. The next peak is at 422 Hz, followed
by a minimum at 633 Hz, and so on. The response is non-minimum phase and can be
corrected with a minimum phase parametric equalizer to some degree, but only at
the very low frequencies.
The effect of the floor reflection can be cancelled by
pre-distorting the direct signal from the speaker. After 2.37 ms from the start
the direct signal has to have a negative step to cancel the first reflected
signal which arrives at the listener. The negative step in turn causes a floor
reflection which must be cancelled by a positive step 4.74 ms later, and so on.
Since the floor reflection is attenuated, consecutive correction steps will
decrease in amplitude (f).
Direct (f) and reflected (j)
signals combine at the listener position for a perfect step response (g),
identical to the anechoic response (a).
The frequency response of the pre-distorted direct signal
(h) may have large peaks to correct for the notches in the room response
(e).
It should be obvious that this form of room correction is
a delicate balancing act, particularly to maintain equalization at higher
frequencies. Small deviations in listener position from the point for which the
speaker was equalized, cause large changes in room response. In real rooms there
is not only the floor reflection, but all the many other reflections from walls,
ceiling, furniture, etc. that enter the correction of the speaker. Since the
correction can at best be valid only for a single sweet spot, it will
necessarily send a distorted signal to every place else. Even at the sweet spot
the system performance does not degrade gracefully, when the correction is less
than perfect. Gross spectral distortion is introduced at higher frequencies and
may become aurally distractive.
Room equalization
with DSP will require a new understanding of what should be corrected, and what
should be left alone, to meet a specific overall objective for sound
reproduction. For example, the comb filter response due to floor reflection is
intimately familiar to us, since most sounds we hear, have at least a floor
reflection. As we grew up and became taller the comb spectrum shifted towards
lower frequencies. How do we use the information conveyed by it? How important
is it to correct for it in a speaker setup? The issue with room equalization is
not about sufficient computing horse power, but how and where to apply it.
The following two references are highly recommended
reading before embarking on any digital room equalization project.
[1] Louis D. Fielder, Practical Limits for Room
Equalization, 111th AES
Convention, 2001, Preprint 5481
[2] Scott D. Snyder, Active Noise Control Primer, Springer/AIP, 2000
Top
L - H-frame and U-frame
open-baffle woofers
The analysis of a H-frame dipole
woofer is rather simple due to the symmetry of the mechanical structure
combined with the fact that front and rear acoustic outputs are of reversed polarity. The
influence of a number of important parameters upon the radiated field can be ignored, since
their effect is equal
in magnitude on both sides of the baffle and cancels because of the 180 degree
phase difference. The analysis becomes
more complicated when the frame is no longer symmetrical and the driver is
moved closer to one of the openings of the frame.
The baffle structure has a physical length L = d1 + d2 and
width and height W. The acoustic length is larger by about W/2 on each end,
similar to the end correction of the vent of a Helmholtz resonator. For
determining the polar pattern I will assume the case where W << L, and
work only with the physical length L. Any calculated 1/4 wavelength resonance
frequency will be higher than in actuality, but that does not invalidate the
relative performance at different driver positions d1. The observation
point is far enough away so that the outputs from front and rear are seen at the
same angle a. The two
propagation paths then differ in length by Lcos(a).
I assume that the driver is operated in its mass controlled region and acts as a
volume source or like an electrical current generator. Using an actual driver
model would complicate the analysis and only be beneficial if we needed to know
absolute numbers. I will also assume that the source is fully symmetrical, as
would be the case with two drivers having their magnets pointed in opposite
directions. A single driver would introduce additional phase shift on its
backside due to the acoustic elements associated with the cavities around the
basket and magnet structure.
Looking from the driver cone towards the rear of the
baffle the displaced volume propagates through a waveguide of acoustic impedance
Zw. If the waveguide were closed off at its end by a wall, then the
volume flow would come to a stop as it reaches the wall and be reflected back to
the source. The wall can be described by an infinite flow impedance ZF.
When the the waveguide is open ended the corresponding flow impedance ZF is nearly
zero. In reality, ZF is an acoustic mass or, electrically, an
inductive element. A small percentage of the flow is reflected back from the
opening towards the source. When the wave hits the cone it is reflected back towards the opening, where again a small
fraction of it bounces back to the cone. This back and forth travel sets up a
resonance at the frequency where d2 equals a quarter wavelength. The major percentage of the
volume flow
exits the opening and expands into the larger free space. Consequently, its
pressure drops relative to what it was inside the waveguide. This can be
described by an impedance Zr which is less than Zw. The
impedance mismatch exists at all frequencies. The
pressure developed across the real part Rr of this radiation
impedance Zr is the quantity of interest.
The circuit above describes the acoustic behavior in
electrical terms. The two loss-less transmission lines are specified by their
impedance Zw and propagation delay T as function of their length d.
The current generator has a finite impedance Rd >> Zw.
The flow impedance ZF is assumed to be zero for the moment. The
voltages VF and VR across the radiation resistors Rr
are summed vectorially using the path length difference L cos(a)
to determine the phase shift between front and rear outputs. The summed signal
is proportional to the SPL at observation angle a.
It is important to work with representative values of Rr
in the electrical model. Assuming Rr = 400 and Zw = 1000
leads to a 1/4 wave resonance peak of about 6 dB. This is in the range of peak
magnitudes that I have measured in the opening plane of H-frame woofers. All
modeling is done for L = 0.6 m (24"), thus for the symmetrical H-frame the
resonance occurs at 340m/s / (4 x 0.3m) = 283 Hz. The graph below shows
magnitude and phase of front and rear radiation.
The frequency response at different observation angles a
is obtained by adding the front and rear outputs vectorially. The analysis was
carried out using CircuitMaker which
is a SPICE program. Notice the slight amount of peaking near the resonance. The
outputs sum to zero at 90 degrees. This would be off the graph. Instead, the 100
degree response is shown.
The polar plot (1) below is drawn on a dB scale with 6 dB
increments between circles. Note that the phase of the acoustic wave to the left
of a = 90 degrees is at +90
degrees, to the right at -90 degrees relative to the volume source excitation.
When the source is shifted slightly towards the front of the H-frame, then the
null occurs at an angle a
that is greater than 90 degrees. Also, the rear lobe decreases slightly in
magnitude (2).
This trend continues and leads to the polar pattern (3)
where the driver has been fully moved to the front of the waveguide. It is the
U-frame configuration. The magnitude of the polar response has increased over
that of the H-frame in the left half of the polar graph. On-axis and below 60 Hz
by 3.4 dB, and at 90 degrees there is no longer any null. The right half of the
graph takes on different shape that are quite frequency dependent. There is no
null, but there is a small region where the phase of radiation is +90 degrees as
compared to -90 degrees for the major portion of direction angles a.
The shape of the polar pattern is strongly influenced by
the impedance that the wave sees at the rear opening. By inserting a flow
resistor RF = 600, so that the waveguide is terminated reflection
free, the response begins to look more like a cardioid. The on-axis response is
6 dB higher than that of the H-frame of same length L.
A cardioid polar response is obtained by the summation of a monopole
response with
magnitude 0.5 in all directions of radiation, M = 0.5, and a dipole with magnitude 0.5
on-axis, D = 0.5 cos(a), such that C = 0.5 + 0.5 cos(a)
. A monopole, such as a closed box woofer, is a pure pressure source. A dipole,
like a H-frame woofer, is a pure velocity source. A cardioid or U-frame woofer
would exhibit characteristics of both monopole and dipole. It
is not clear what the room acoustic benefits might be. Unlike the H-frame with
its 90 degree nulls, these types of mixed radiators can excite room modes at ALL
angles. Even the null towards the rear of a pure cardioid woofer does not
prevent the excitation of the room mode along the 0 degree to 180 degree
axis.
I have heard a rock band that used big Meyer
Sound cardioid woofers in a very open setting. Walking around the stage there was a clearly
audible reduction of low frequencies in the back. More slam for the audience,
less for the neighborhood.
In a normal living room there could be an application for a cardioid above 1 kHz
to reduce reflections from objects behind the speaker, if that were an issue.
It's a different story for microphones where the cardioid pattern can provide a
clear benefit by reducing unwanted sound pickup.
If you have any interested in further analysis of the
U-frame woofer, then go to Appendix
L .
Top
| Page 1 |
Page 2 | Page 3 | Page
4 | Page 5 | Page
6 | Page 7
|
| 