|
|
|
Loudspeaker & Room characterization+++ Test & Measurement +++ Phantom center +++ Case studies +++
Case studies+++ CM-LX521 +++ CM-B2031 +++ SPC-Watson +++ SPC-LX521 +++ SPC-Pluto +++ Mixing Studio +++
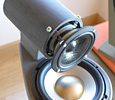
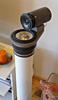
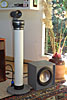
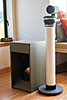
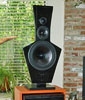
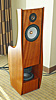
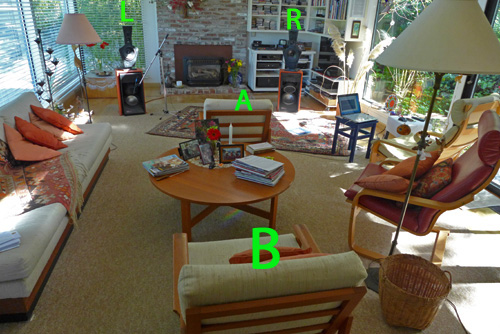
!!! Under Construction !!!Corte Madera living room with LX521 loudspeakersSound from a loudspeaker is reflected by its environment. In a room the reflections of a short duration sound bounce around between the walls, floor and ceiling and decay into the background noise. A listener hears his brain's interpretation of the direct sound stream from the loudspeaker, followed by and superimposed with early reflection and reverberation streams. It is natural for the brain and based on evolution to estimate the location of the sound source, its distance and size and and to differentiate all that from the reflections in the given environment, based on imbedded or quickly learned knowledge of its acoustic properties. Thus the accuracy with which we localize the loudspeaker in the room depends upon our location, the loudspeaker's polar pattern of radiation and the reflective, diffusive and absorptive properties of the room. If two loudspeakers are used and a phantom source is created, then the same parameters determine the degree to which the brain can withdraw attention from the physical location of the loudspeakers and the acoustics of the listening room. The following ping tests give a description of the acoustic behavior of the listening room in the time domain when stimulated by a similar burst signal in different frequency bands. The relevance of the shape of the time response at the listening position must still be understood. By comparing ping tests from different rooms to listener's descriptions of sound in those rooms one might hope to gain such understanding. Thus it would be important for large numbers of listeners to participate in the experiments. Room setups should be described, ping data taken and a verbal description of the owner's assessment of the loudspeaker-room-setup listening performance. The OPLUG forum has installed a Ping Tests section where such discussions should take place. On my website I will give examples for my listening rooms and loudspeakers and others that I have access to. This could become a major step to firmly establish the optimum loudspeaker and room combination for creating a 3D stereo illusion. But it could also turn out that the brain uses cues, which are not obvious from these data.
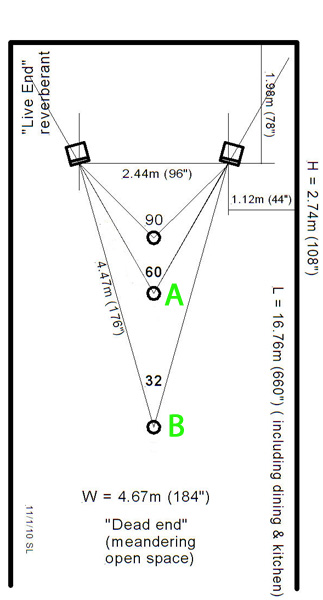
1) - Room and Loudspeaker Setup
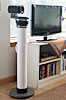
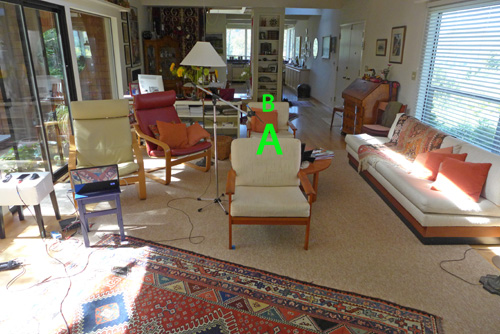
This is my main listening room for which I have designed ORION and LX521. Much of my listening is from location B, though imaging detail is smeared compared to location A where the chair has to be turned around to face the speakers. It then forms an equilateral triangle with L and R. There is no tone color change between A and B or other locations in the room. Acoustically the room is very long as it opens up in the back to kitchen, hallway and staircase. Sound from the speakers essentially travels past the listener and disappears in the rest of the house. The microphone for the room measurements was placed about where the center of my head would have been. Thus one can expect to also see reflections from the listening chair in the data.
2) - Test Data
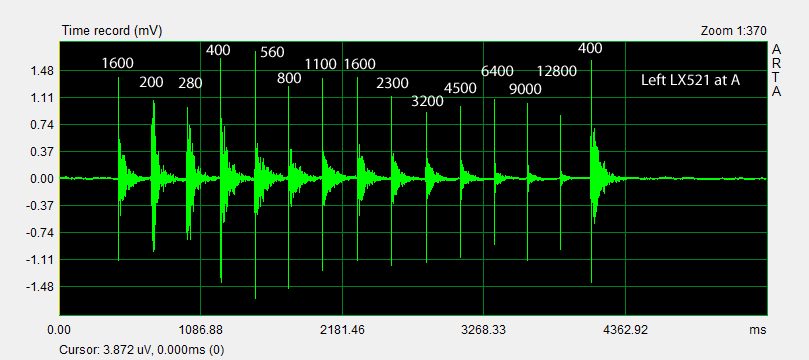
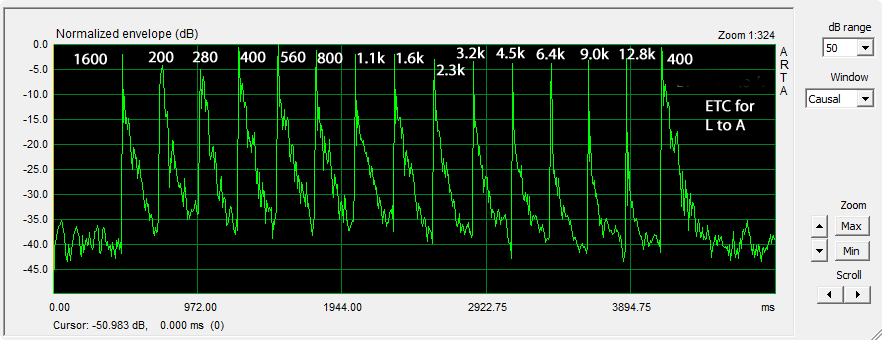
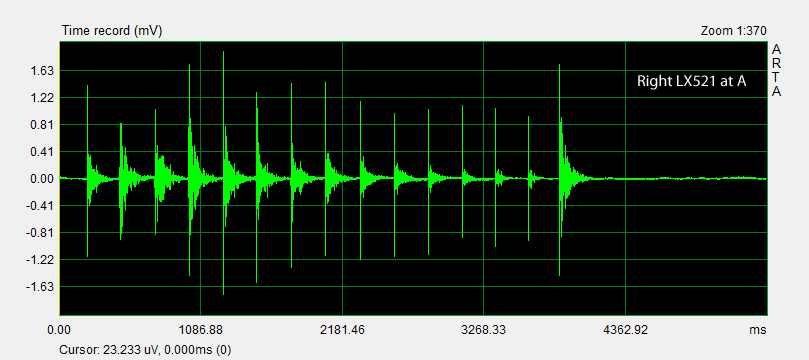
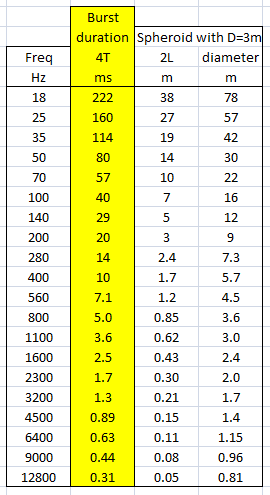
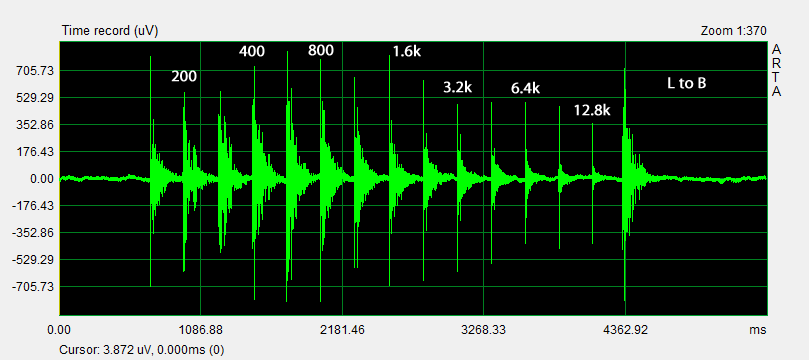
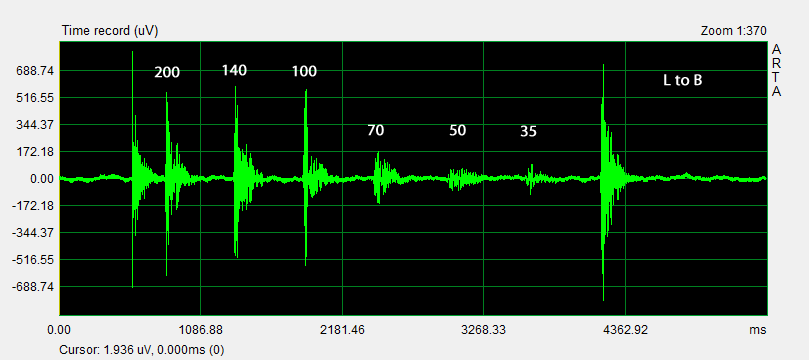
3A) - A first look at the room response200 Hz to 12800 Hz 01__CM-LX521-L-NormalSetup-seatA.pir
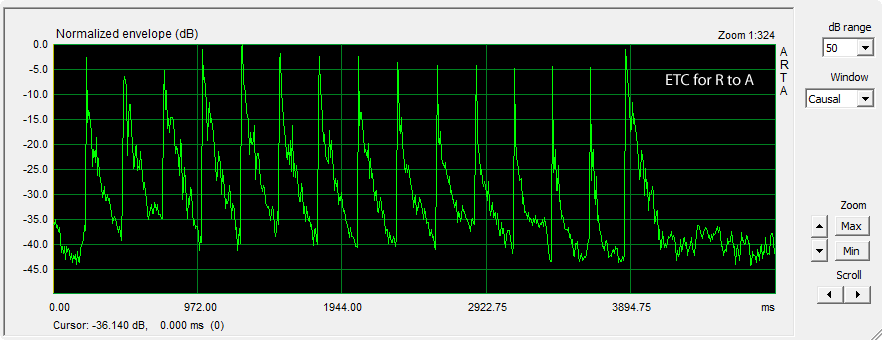
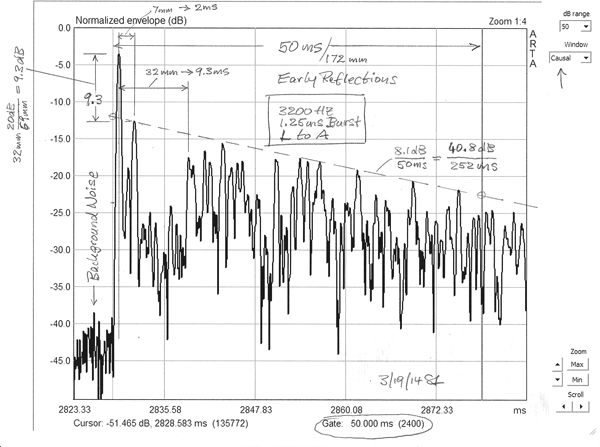
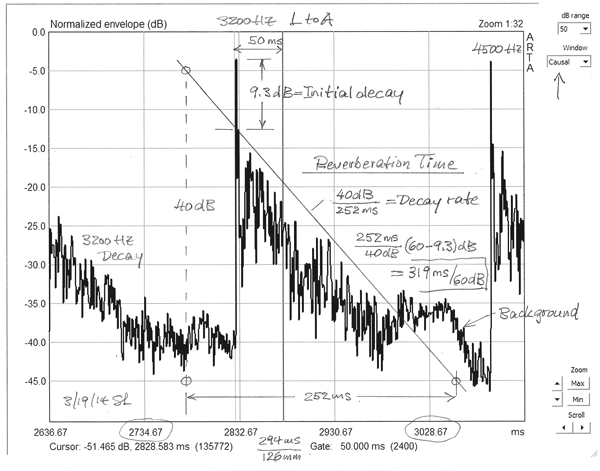
The response at seat A consists of the direct burst signal and its reflections from various locations in the room and decaying as they are re-reflected many times and lose energy. At 6400, 9000 and 12800 Hz the magnitude of reverberant sound is significantly lower than below 400 Hz. This shows particularly well in the same data plotted as Energy Time Curve below in a 50 dB vertical axis window. It is the full-wave rectified signal from above on a logarithmic amplitude scale. The burst decay seems to have a similar slope at all frequencies. For burst frequencies of 560 Hz and below one can expect that the first reflections will overlap the direct burst signal.
The general shape for the right speaker's response at listening position A is similar to that of the left speaker above. I do not know which detail differences are audibly significant. Many more room tests are needed to establish such correlations. The data here for what is empirically a very good listening environment and setup for 3D phantom scene generation with the LX521 can serve as reference information. I shall compare it to the LX521 in my much smaller SPC vista room where I am likewise very satisfied with the speaker's realism of rendering acoustic scenes.
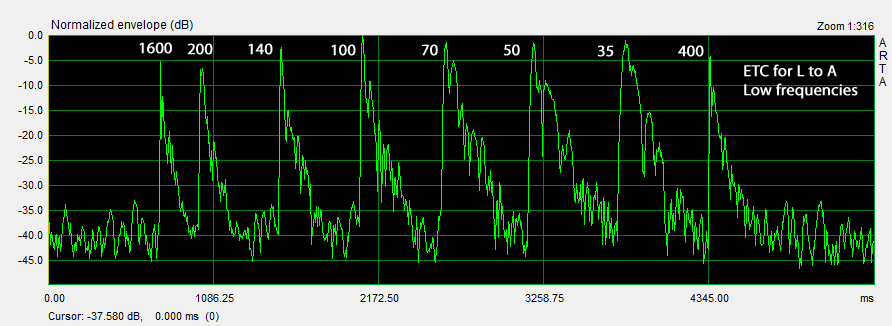
200 Hz to 35 Hz 02__CM-LX521-L-NormalSetup-seatA.pir
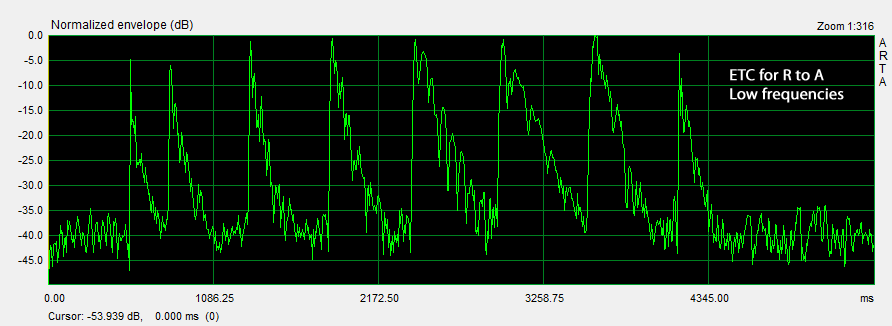
At low frequencies, as shown here by the ETC for left and right speakers from 200 Hz down to 35 Hz, reflected bursts overlap with the long duration direct burst. The decaying burst response indicates periodicities, which are most clearly seen at 100, 70 and 50 Hz for the right loudspeaker. They are periodic reflections between surfaces (like flutter echo at high frequencies) and point to room modes. Typically room modes or room resonances are measured and plotted in their steady-state condition. Here we see the modal response to a burst transient and how it affects the burst decay. 02__CM-LX521-R-NormalSetup-seatA.pir
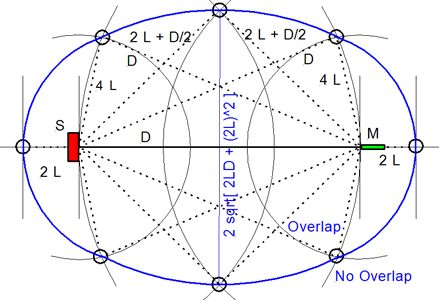
Reflection overlap with the direct signal
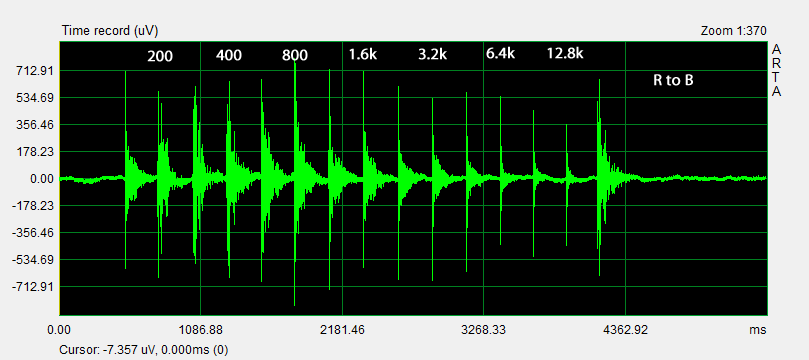
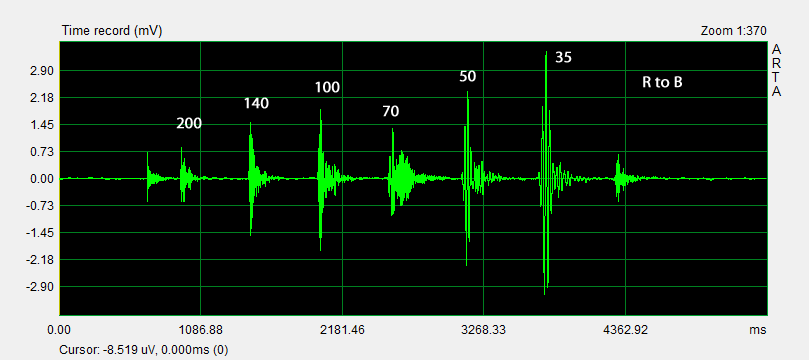
3B) - A first look at the room responseNow we take a look at the response at listening seat B, at almost twice (1.83x) the distance of seat A from the speakers. I listen a lot from there but with a loss of imaging detail. Spectral balance remains the same as it is pretty much everywhere in the room whether seated or standing. 200 Hz to 12800 Hz 01__CM-LX521-L-NormalSetup-seatB.pir
01__CM-LX521-R-NormalSetup-seatB.pir
Compared to 3A) above the amount of reverberant energy
relative to the direct signal burst has increased. This is to be expected. 200 Hz to 35 Hz 02__CM-LX521-L-NormalSetup-seatB.pir
02__CM-LX521-R-NormalSetup-seatB.pir
The low frequency response differs strangely between left
and right speakers and from the response at seat A. In particular the low
response due to the left woofer at 70, 50 and 35 Hz prompted me to check
the polarity of the woofer drivers acoustically from close distance and to
compare the result to the right woofer. Everything was fine, but the
measurements require further investigation. Strangely, I do not notice any loss
in bass at seat B.
4) - Interpretation of DataHere we have already a large set of data without even looking at L&R, the sum of left and right at listening positions A and B. There are obvious patterns due to the nature of the ping signal and its time duration relative to the delay of early reflections.
|
|
| ||||