|
|
|
Loudspeaker & Room - case studies+++ Acoustic polarity +++ Phantom center +++ Room test signal +++ Room reflections +++ Driver distortion +++
Test signals for
room reflection
|
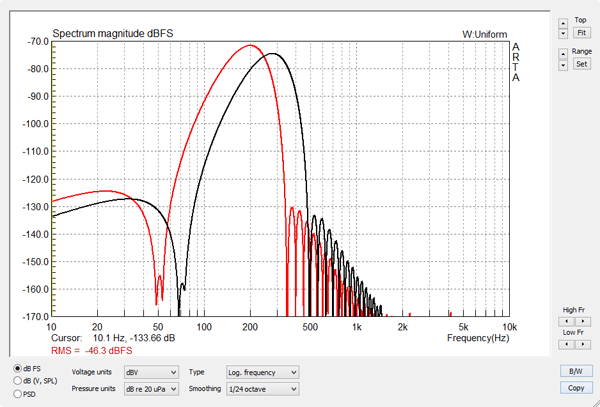 |
Figure 4
The spectrum of the 200 Hz burst covers a range of frequencies around 200 Hz and overlaps with the spectrum of the 280 Hz burst. The peak of the spectrum decreases at 6 dB/oct with increasing frequeny. Though the peak amplitude and the rms-value of each burst is the same, its duration changes as 1/f and thus its energy in Ws decreases. |
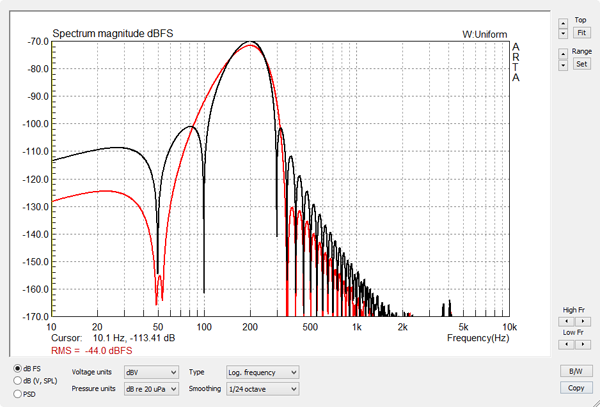 |
Figure 5
A 4-cycle burst with a Blackman envelope is described in the GoldWave Expression Evaluator by: 0.95*((0.42-0.5*cos(pi*(f)/2*(t-(4/f)))+0.08*cos(pi*(f)*(t-(4/f)))) A 4-cycle burst with a Cosine envelope is described in the GoldWave Expression Evaluator by: 0.95*((0.5-0.5*cos(2*pi*t*f/x))*sin(2*pi*t*f))*(step(t)-step(t-(x/f))) The Blackman burst (red) has higher out-of-band attenuation, which gives useful dynamic range for 2nd and higher harmonic measurements. |
The burst response, Figure 1, is captured using the Signal Recording capability of ARTA. In this mode ARTA acts like a digital storage oscilloscope. The burst sequences start with a 100 Hz burst and end with a 400 Hz burst. The record button should be pushed after the 400 Hz burst has been heard to capture the next sequence of the repeated burst file. I use an E-MU Tracker Pre two channel USB Audio Interface unit with my notebook computer. Microphone input and headphone output of the notebook could be used instead, but I get less dynamic range. A modified Panasonic microphone capsule with 9 V battery supply for low distortion picks up the burst signal and any other sounds in the room, which are present during the 5.461 second recording time. Thus the signal to noise ratio of the burst recording and its dynamic ranger are directly affected by how quiet it is in the room and by the volume level of the bursts. I maximize the burst volume to a level below noticing distortion.
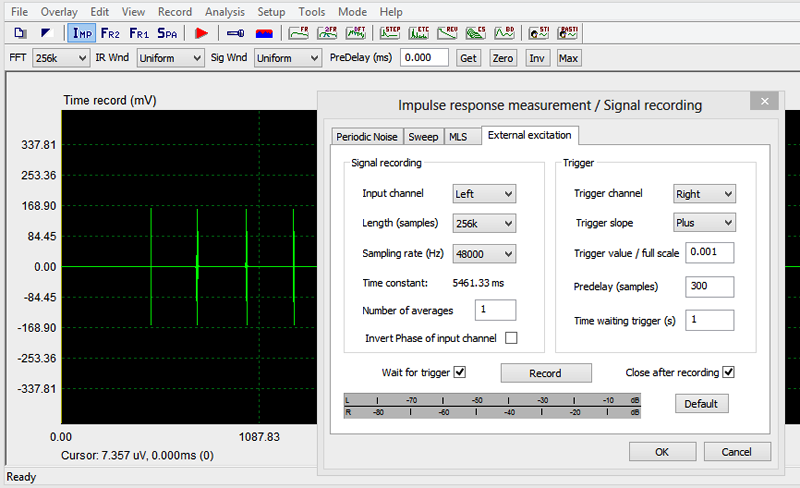 Figure 6
After the recording has ended push the Zoom Min button to to see the burst response. Using Cursor and Gate markers (left and right mouse buttons) identify the burst to zoom in on by stepping up Zoom Max. The visual dynamic range of the linear amplitude display is not very large and also confused by seeing a positive and negative going signal. Much greater range is obtained by taking the absolute level of the burst wave (= full-wave rectification) and displaying the result on a logarithmic amplitude scale. In ARTA this is accomplished by selecting the ETC mode with a causal window. Again, the Zoom Min button has to be pushed to see the signal as in Figure 7.
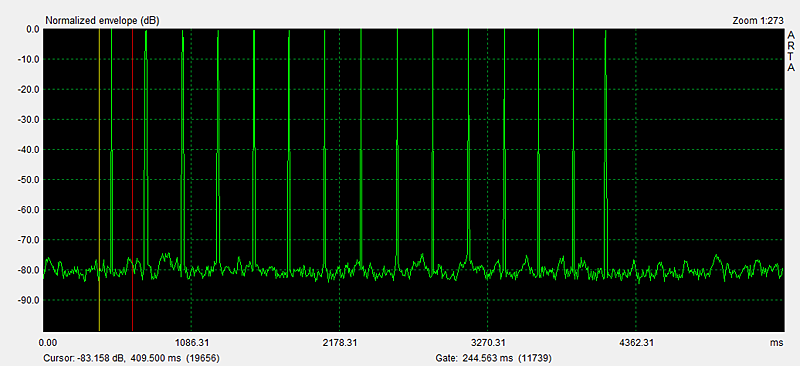 Figure 7
Stepping up Zoom Max the actual waveform of the rectified burst with its 8 maxima becomes visible. Figure 8.
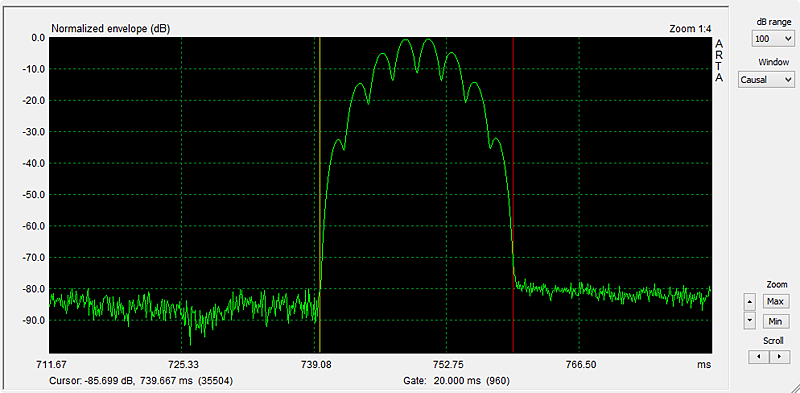 Figure 8
Reducing the dB range to 50 dB, going down from the top, gives the window that I use normally for room reflection measurements. Figure 9.
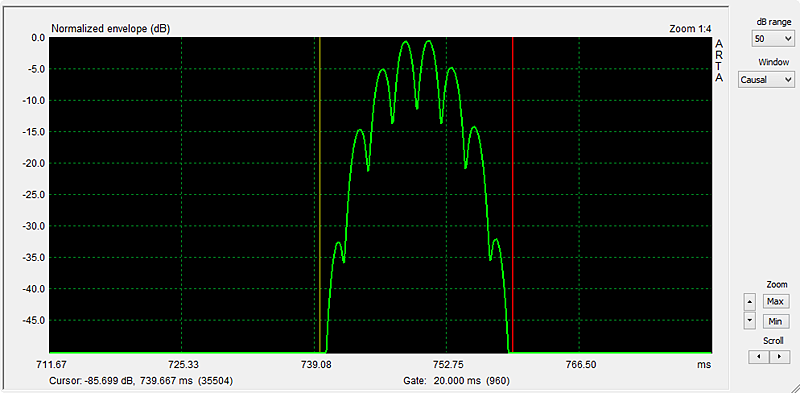 Figure 9
The burst sequences were constructed using the Expression Evaluator and Copy and Paste functions in GoldWave. Frequencies in File-01 cover the reverberant frequency range above the Schroeder frequency of typical listening rooms. It is also the range where maximum volume can be obtained from a typical loudspeaker for higher signal to noise ratio of the test. Table 1.
File-02 and File-03 cover the modal frequency range of typical listening rooms and include low frequencies which tend to be problematic for drivers, thus requiring lower volume settings for the burst sequence.
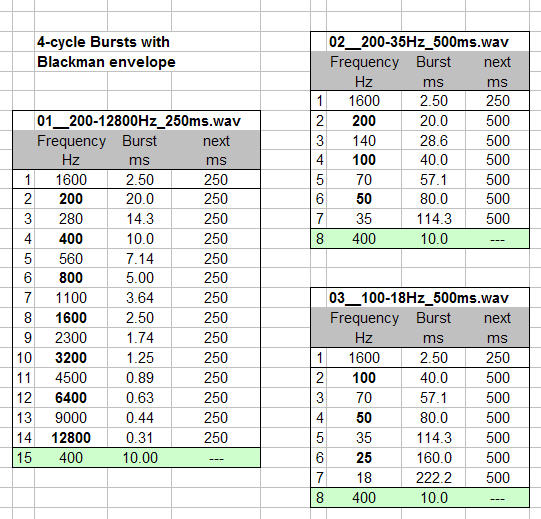 |
Table 1
Download Burst files: Play the files in Repeat mode. Push Record in the ARTA Signal Recording window when you hear the 400 Hz burst at the end of a burst sequence. For practice, download and open with ARTA the "impulse response" file, which was used for the above graphics: |
I have used envelope shaped tone-bursts at a time when Fourier Analyzers were not common-place and also to investigate stored energy (resonance) in drivers. ARTA provides this capability in its Burst Decay mode. My paper on "Room Reflections Misunderstood?" was an attempt to correlate visual reflection data with auditory observations. I offer a Toneburst Test Signal CD to investigate the articulation of low frequency sounds and for various loudspeaker and room tests.
With the burst signal sequences of Figure 10 I hope to establish a set of standard test signals for room response measurements that are relatively easy to interpret regarding the physical nature of the response. Understanding what matters audibly and how it correlates with what is visual in the burst response at different frequencies has still to be learned and confirmed against intuition. Testing rooms with empirically known good or poor stereo performance should serve as guidance. Testing speakers with different radiation patterns and therefore different room interaction should give further insight when comparing test data to perceptual differences.
I will start this process for the rooms and speaker setups that are available to me.
Ambient noise deteriorates the dynamic range of acoustic burst measurements. The time record is broadband and the ETC is not frequency selective. File 01 only consists of burst frequencies above 200 Hz. A 155 Hz 3rd-order Butterworth highpass filter after the microphone is effective in reducing low frequency rumble and 60 Hz hum from various machinery. The following circuitry also provides -9 V bias for the electret microphone capsule and is powered by rechargeable batteries.
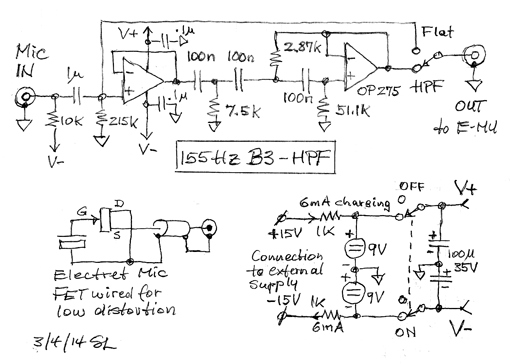 |
 Figure 10 Figure 10 |
The effectiveness of the filter is visible in the wave form of the burst ETC taken in my small office room. The highpass filter was used in Figure 11, but not in Figure 12. You can compare the two files in more detail using ARTA with office-hpf.pir and office-no-hpf.pir.
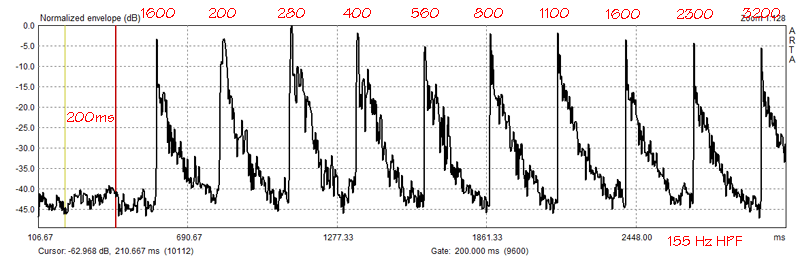 Figure 11
|
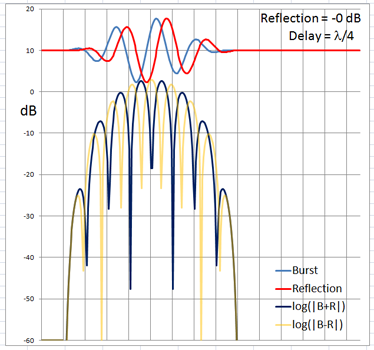
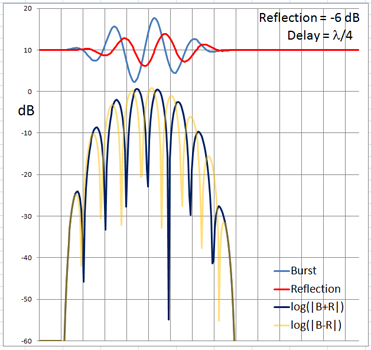
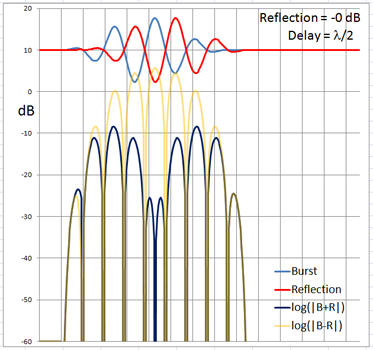
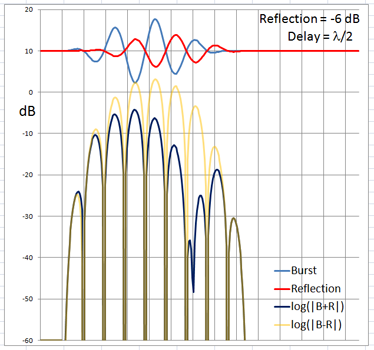
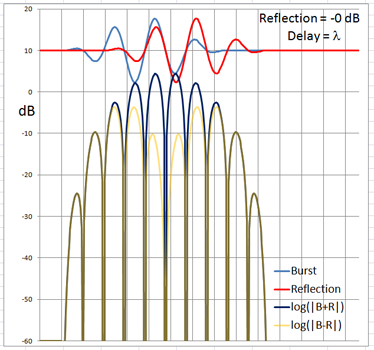
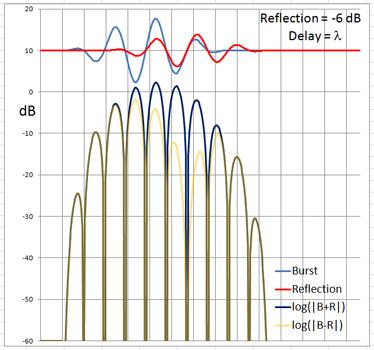
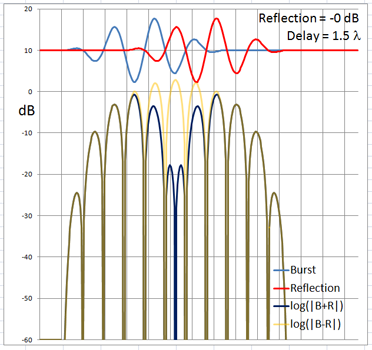
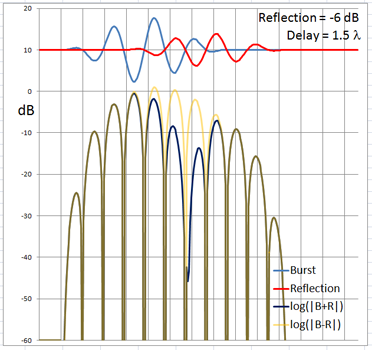
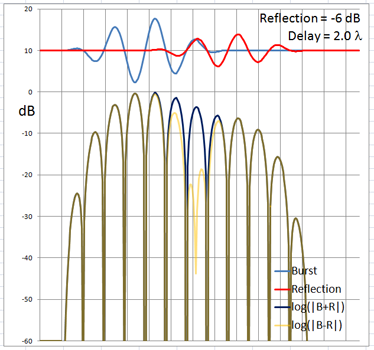
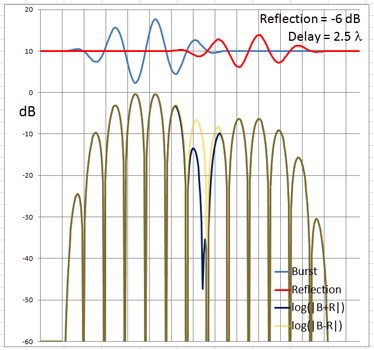
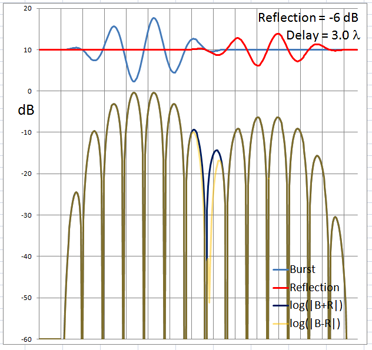
The 4-cycle burst has a duration corresponding to four wavelengths at the chosen frequency. At low frequencies and long wavelengths reflections will overlap in time with the direct signal if the reflecting path is less than four wavelengths longer than the direct signal path. Below are examples of the ETC for a single reflection at 0 dB (not likely) and -6 dB overlapping with the direct signal at different delays. (burst-overlap.xlsx)
 |
 |
|
 |
 |
|
 |
 |
|
 |
 |
|
 |
 |
|
 |
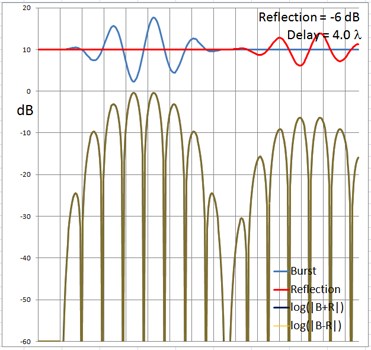 |
From the above pictures it should be apparent that one can say little about the first reflection once it overlaps in time with the direct signal from source to microphone. Ranging and finding the origin of a reflection can only be done with burst frequencies above 1 kHz for typical listening room dimensions and loudspeaker setups.
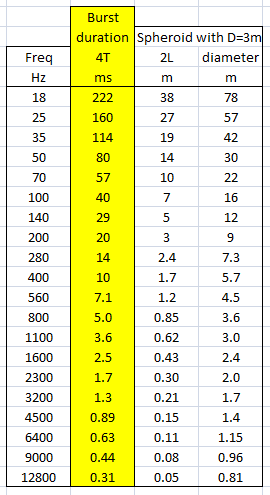 |
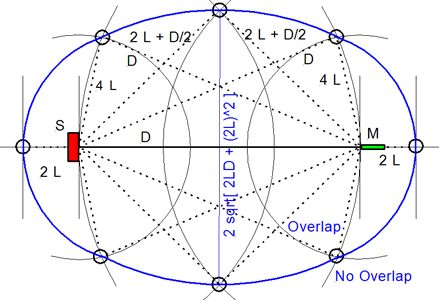
The boundary between an overlapping and not overlapping reflection is the surface of a spheroid with an axis of rotation of length a = D + 4L and a maximum diameter b = 2sqrt(2LD + (2L)^2) where D is the distance between burst source S and microphone M. The minimum overlap free distance 2L applies to reflections from directly behind the source or directly behind the microphone. Reflections from objects inside the spheroid overlap the direct signal. The size of the spheroid increases with lower frequencies and longer burst durations. |
See also WATSON loudspeakers outdoors of Sea Pine Cottage as an introductory ping test example
************************************************************************************
|
| ||||
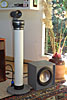
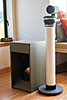
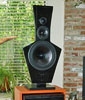
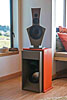
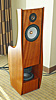
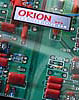
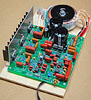
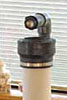
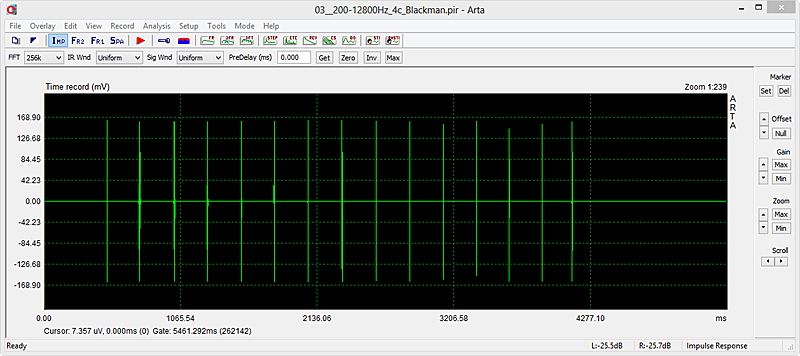 Figure 1
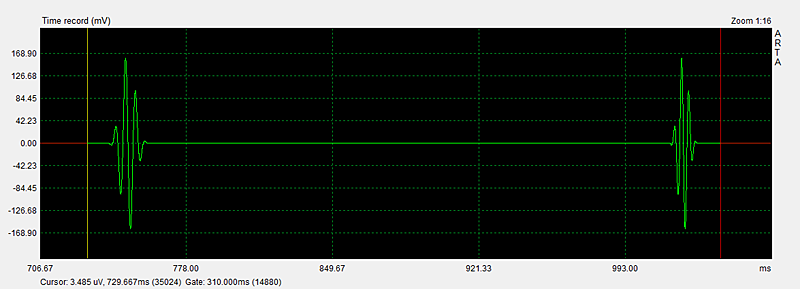 Figure 2
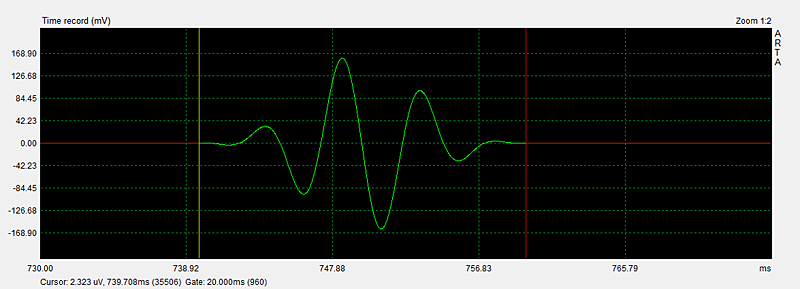 Figure 3
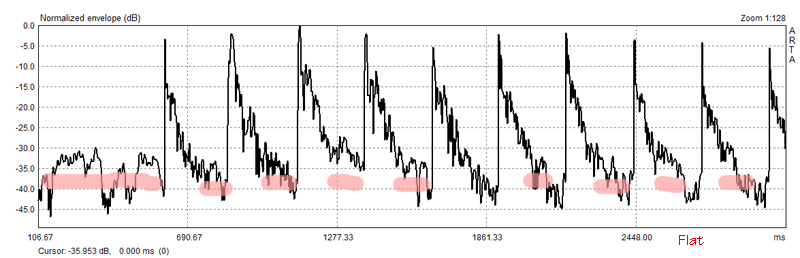 Figure 12