|
|
|
Ping Tests+++ Acoustic polarity +++ Phantom center +++ Room test signal +++ Room reflections +++ Driver distortion +++
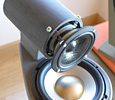
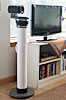
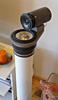
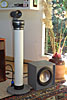
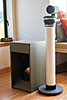
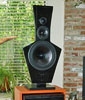
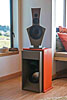
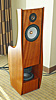
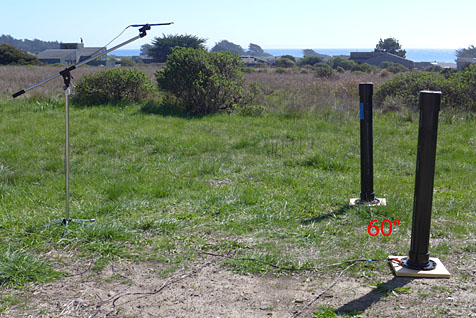
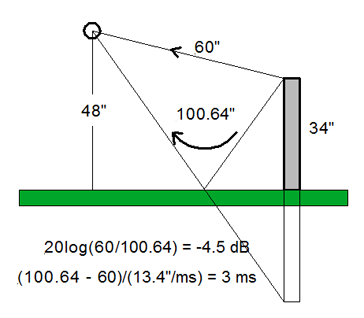
Room reflections+++ CM-LX521 +++ CM-B2031 +++ SPC-Watson +++ SPC-LX521 +++ SPC-Pluto +++ Mixing Studio +++ WATSON loudspeakers outdoors of Sea Pine CottageAs an experiment I set up the WATSON outdoors where there would be few reflections, except for the ground reflection. On phantom center tests I could hear distant echoes. The breaking waves of the Pacific Ocean gave a fluctuating and fairly high background noise level on the day of the experiment. Using voice signals the center phantom is is heard only in a spot along the symmetry line. Moving slightly left or right the timbre changes. For larger displacements the timbre is as for the center spot and the image is between center and the nearest speaker. When standing in front of left or right speaker the phantom source spreads from the speaker somewhat towards the center. 1) - Outdoor Loudspeaker Setup
2) - Test Data
3) - A first look at the outdoor response
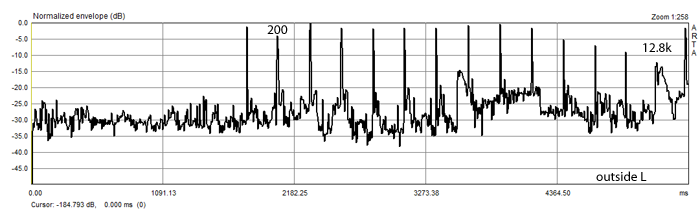
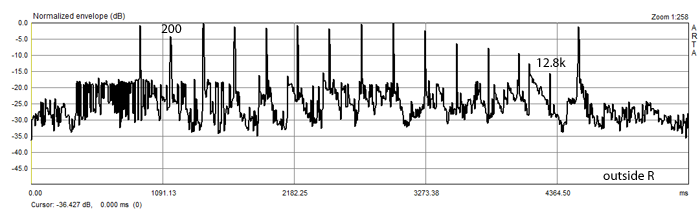
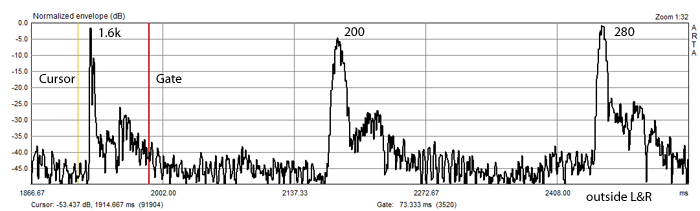
The response for the left WATSON speaker above exhibits a large amount of background noise as does the response for the right speaker below. The 12.8 kHz burst is masked gy a large transient, which also occurs around the 1600 Hz burst. A reverberant signal decay in the 250 ms between bursts is not visible and also not expected for this outdoor experiment.
The decrease in burst amplitude above 2300 Hz is due to high frequency roll-off of the upwards firing WATSON. The start of the time record is poorly defined and somewhat hit-and-miss. I have not yet found the optimum trigger procedure for ARTA.
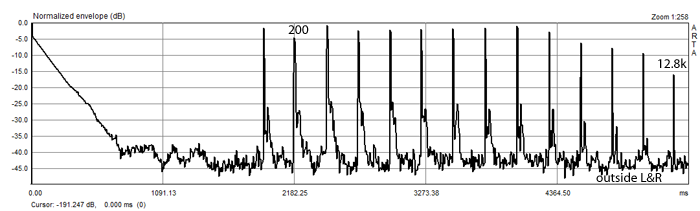
The time record for left and right speakers active
together should have a 6 dB higher signal to ambient ratio. The trace for
L&R represents a lucky moment as also the
background noise is very low. It appears that it follows a large transient which
overloaded the microphone preamp or the 155 Hz highpass filter. A major
reflection is visible at all frequencies except at 12.8 kHz. Except for low
frequencies of 200, 280 and 400 Hz its amplitude follows that of the bursts. A
closer examination is in order by zooming in on the response for different burst
frequencies.
4) - Interpretation of Data
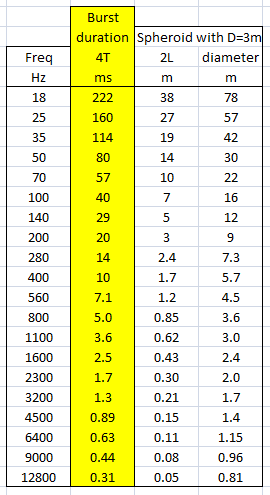
The burst sequence starts with a 1.6 kHz burst, which indicates a close-in reflection of about 9 dB lower level than the direct response. It is followed about 35 ms later by several reflections, which are more than 24 dB down. The vertical lines for Cursor and Gate are separated by 73.333 ms in this example. Their purpose is for time measurements and signal identification. The duration for a 1.6 kHz burst is 2.5 ms according to the table under 5) below. That duration is short enough to resolve the first reflection from the direct signal. For a 200 Hz burst of 20 ms duration the first reflection, which is 3 ms delayed and 20 ms wide, overlaps almost completely with the direct signal. The resulting signal shape can take many forms. The presence of reflections with 35 ms delay only complicates the interpretation of the response shape. The outside test produced an audible echo. Maybe the cluster starting 80 ms after the 200 Hz burst is an indicator of this echo.
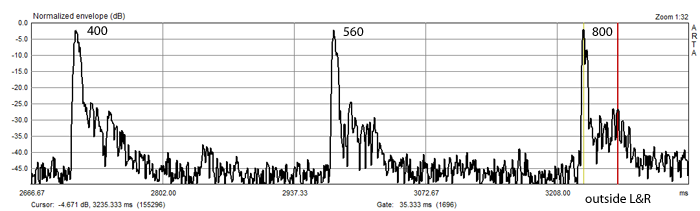
With the 800 Hz burst one begins to see readily explainable details of this outside test setup.
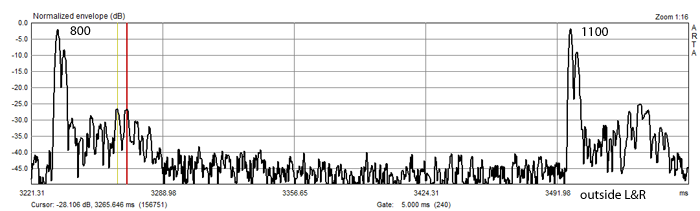
The first close-in reflection is followed by several lower level reflections, which appear to be caused by the proximity of the building structure to the right side of the speaker setup, which is not visible in the photo above. In particular the pair of reflections in the 5 ms Gate are likely caused by left and right speakers, which are separated by 60" or 4.6 ms. This is confirmed by viewing the left and right speaker responses individually. The earlier reflection is due to the right speaker, which is closer to the building than the left speaker. The building is not just a flat surface, but has also has a deck with fence and corners and a balcony and causes therefore multiple reflections.
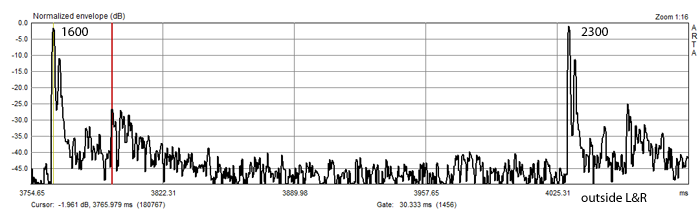
Temporal resolution increases with increasing burst frequency. The ambient background signal changes continuously and adds therefore differently from burst to burst since they occur only in 250 ms intervals. Background signals strongly affect the appearance of low level reflections. One has to look at several bursts to identify a particular phenomenon.
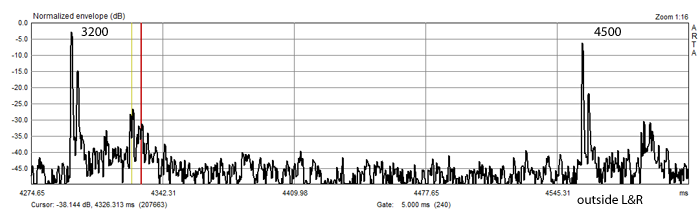
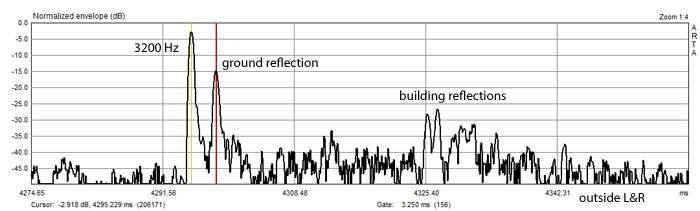
Furthermore the degree of Zoom must be sufficiently high so that the limited number of horizontal screen display pixels does not affect the curve shape as seen here for the 3200 Hz burst with a Zoom of 1:16 and a Zoom of 1:4.
The simple outside test example illustrates how to analyze the burst response. Matters become much more difficult in enclosed spaces, where reflections reverberate and decay gradually. It seems that both, the nature of the early reflections and the nature of the reverberant level and decay, contribute significantly to how the stereo phantom scene is experienced. The correlation between the acoustic ping test data and perceptual phenomena has yet to be established
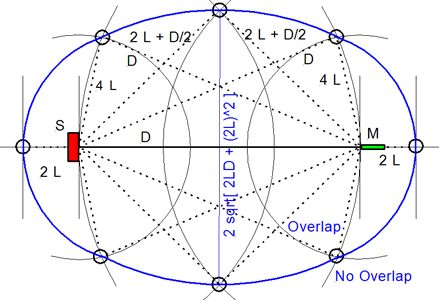
5) Reflection overlap with the direct signal
See also Test signals for room reflection and driver distortion investigations
***********************************************************************************************
|
|
| ||||