|
|
|
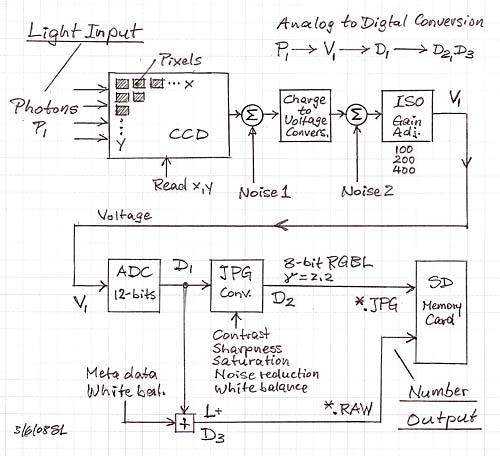
Digital Photo Processes-- Introduction -- Lens & image -- A/D conversion -- Lumix & Leica -- Sharpness -- CCD noise1 -- CCD noise2 -- 5 years later -- Analog to digital conversionThe CCD or CMOS sensor in a digital camera converts light photons into electrons. Each of the millions of sensor pixels accumulates an electric charge that is proportional to the number of photons which it collects. Each pixel has a red, green or blue filter in front of it. The filters are arranged in a Bayer mosaic pattern consisting of two green, one red and one blue filter and a micro lens for each. After a picture has been taken and the sensor has been exposed to light, the charge from each pixel is read out and converted to a voltage. The pixel charge is reset to zero, i.e. to black. The conversion process adds electrical circuit noise to the light voltage. Further noise is added when the voltage is amplified in order to work with the camera in low light at increased ISO. The voltage which represents the luminance of each pixel is then converted into a binary number by a 12-bit analog-to-digital converter. Information about a pixel's x and y location is added, as are metadata about the sensor's color filters and chosen camera white balance setting. This becomes the RAW data file that is stored in the camera memory on a removable SD card, for example.
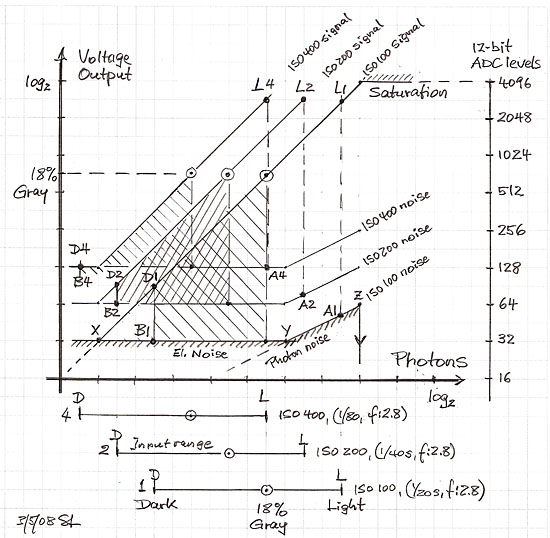
The light which is reflected from a scene can span a wide range of intensities, like 10000:1 between highlights and shadows. A large CCD sensor may be able to capture that range without saturating or clipping the highlights and losing shadow detail in its noise. The output voltages from the various pixels would simultaneously vary linearly over that same 10000:1 range. The human eye and brain system does not work the same way and compresses that wide scene range into a much smaller perceptual range depending upon where the eye is focused at the moment..
The large range of output voltages V1 that is generated by the photon conversion process is, for example, digitized by a 12-bit linear ADC for storage as a RAW file. The JPG file, though, has only 8-bit luminance information, corresponding to a light range from 0 to 255. It is derived from the 0 to 4095 range of the 12-bit ADC output D1. In a direct 12 bit to 8 bit conversion the first 2048 levels would be represented by the first 95 levels of the 0 to 255 range. The next 1024 levels would be represented by 60 levels and so on as in the table below. This type of conversion would assign too many levels to the highlights of a picture and not enough to the dark regions. As a trade-off the conversion is done with a slope of 1/2.2 = 0.45 which is called gamma = 2.2. The last column in the table shows the corresponding distribution and the graph shows the 12 to 8 conversion on log-log scale. An 8-bit JPG file is also used to generate the luminance histogram on the camera's LCD and therefore under-represent what is captured in the RAW file in the critical highlight area to the right edge of the histogram.
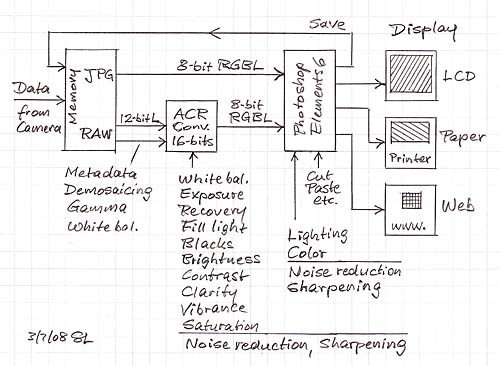
Data file post-processing and renderingThe RAW or JPG picture files from the camera are further processed in a computer for eventual presentation on a CRT or LCD display, for a paper print, or for the Internet. Each has different requirements. The LCD can render a wider range of luminance than the reflected light from a print and the gamma compression is undone. Their color spaces are different. The Internet file has to be small for speedy transmission, low storage requirements and to fit the allocated size in the display.
Measured Light-to-Data transfer functionsUsing a constant intensity light source, and then taking pictures of it at constant aperture and stepped shutter times, gives a series of photographs which can then be evaluated numerically in post-processing. Over 40 RAW files were collected for a Lumix FZ50 camera. They were converted in ACR and then an area of 350 x 350 pixels was analyzed for the mean value of the 8-bit RGB data and the standard deviation of their luminance.
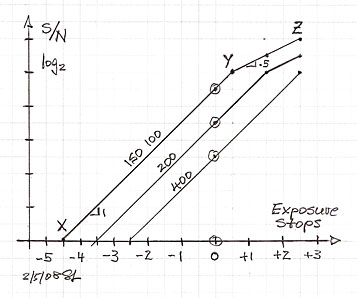
The four S-curves above are the result of one way of plotting the measured data points. When plotted on log-log scales and against the actual exposure times, then their shape looks different, see below, and reveals low luminance level information more clearly. In particular, the signal-to-noise ratio at different ISO values can be seen. S/N is the ratio of the luminance mean value to its standard deviation. Even with the measurement uncertainties involved, it can be seen that S/N has a slope of 1. This indicates that the noise is additive as in the circuit noise region discussed above. The small sensor in the FZ50 is far from being photon noise limited.
Plotting the same measured data again on log-log scales, but against relative exposure, highlights changes in the shape of the S-curve and the degradation of S/N with increasing ISO. A relative exposure of 0 below corresponds to 1/4 s for ISO 100, 1/6 s for ISO 200, 1/15 s for ISO 400 and 1/25 s for ISO 800 in the two graphs above. This data presentation describes the change in luminance and S/N when a picture is taken of a scene for which the light ranges from -6 to +2 stops and the average corresponds to 18% gray at 0.
It would take more experience than I have to relate the
measured curves and their shape to details of the final image quality. Note,
though, the change in the slope of the luminance curves below -3 stops. It
becomes shallower as ISO increases. Contrast and blackness are lost as noise
takes over. The effect will be different when viewed on an LCD with high
contrast ratio or when a color print is made on a
specific art paper. The curves illustrate the well-known degradation that can be
expected from increases in ISO. The analog to digital conversion process description above should have made it clear that RAW capture is essential in order to minimze data manipulation in a 3 x 8-bit RGB preprocessed data space. The highest image quality is obtained if the ACR converter is used to optimize all the various image parameters before generating 8-bit RGB data for further processing in PS Elements 6. No such conversion takes place in Adobe Photoshop Lightroom and the RAW data are processed with full dynamic range. Unfortunately I could not find access to the mean and standard deviation values in 12-bit space to see if the 8-bit graphs above misrepresent the the inherent capability of the camera. I doubt it though.
References: 1 - Making the Transition from Film to Digital, AdobeTechnical
Paper -- Introduction -- Lens & image -- A/D conversion -- Lumix & Leica -- Sharpness -- CCD noise1 -- CCD noise2 -- 5 years later -- |
|
| ||||