|
|
|
Digital Photo Processes-- Introduction -- Lens & image -- A/D conversion -- Lumix & Leica -- Sharpness -- CCD noise1 -- CCD noise2 -- 5 years later --
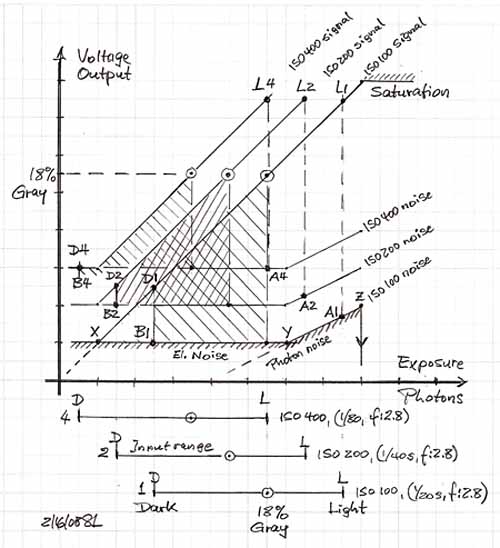
4 - CCD photo sensor noise - Some basicsThe Photon Transfer Curve describes a sensor's noise floor and its saturation point. The dynamic range of a camera can be derived from this. The PTC is not available to a camera owner but its general shape is useful to explain what can be measured or observed in photographs by varying the light input level to the sensor and its ISO setting as shown below.
It is obvious from this example that the noise in the dark portions of a digital photograph will always be higher than in the bright portions. An increase in ISO always means an increase in noise and a decrease in dynamic range. A compact camera suffers especially from this because its light sensor uses a very small area for collecting photons in each of its pixel locations. Light sensitivity is directly proportional to pixel area. The electrical noise, though, is about constant regardless of sensor size. Thus the superior S/N of a larger sensor with the same number of pixels.
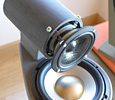
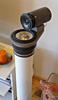
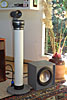
5 - CCD photo sensor - S/N measurement procedure
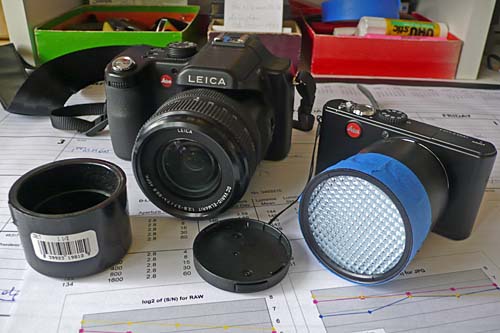
"The target WHITE DENSITY RATING of the ExpoDisc is 0.745 which corresponds to an 18% reflectance of incident light. This density (18% reflectance) falls within Zone V ± 1/6 f/stop. Zone V ± 1/6 f/stop has a range of 0.695 to 0.795. No adjustments need to be made." (FAQ 12) The White Balance in the camera is set to compensate for the color of the incoming diffuse light, so no special lighting is needed for the tests. The gray photos are measured using the Histogram window in Photoshop Elements 6. It reads out the Mean and Standard Deviation of the selected pixel area. I usually take a square area of about 120k pixels in 100% screen display mode. Noise reduction must be set to zero in ACR for RAW file noise measurements, obviously. Both, Color and Luminosity (gray) Channel values are measured. It is interesting to observe the change in distribution function. The Info window in PE6 allows measurement of individual pixel RGB levels. The range of output levels goes from zero to 256 = 28 and covers 8 octaves or f-stops. Normal exposure is at a seemingly high level of 150 = 27.23 due to sensor non-linearity and compression of the photon input signal range into a narrower output voltage range.
6 - Camera output signal and noise measurementsFor camera comparison purposes all transfer function measurements were taken at ISO 400 where the noise level was expected to be high, but where scene photos of useable quality can hopefully still be taken. The camera with the ExpoDisc in front of the lens was pointed towards a light source to obtain an exposure time of 1/15 s at f:2.8. Lens focus was manually set to infinity. White balance was adjusted automatically in the camera. Nine RAW files were then generated with manually set exposure times ranging from 1/500 s to 1/2 s. The nine photos were opened with Adobe Camera Raw in
Photoshop Elements 6. ACR default settings were used except that all noise
reduction was set to zero. A 120k pixel square from the center of the photo was
then measured with the Histogram window functions of PE6. The results for Mean
and Standard Deviation were recorded in a spreadsheet.
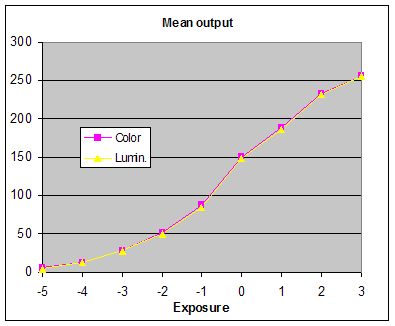
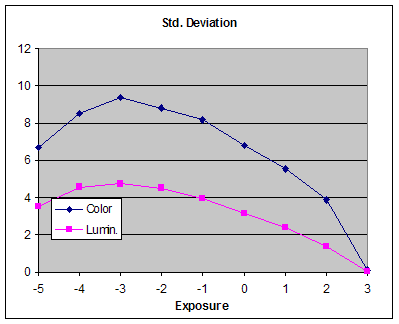
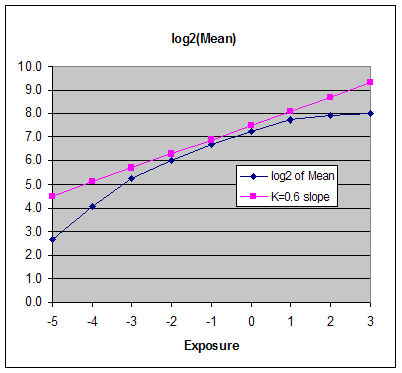
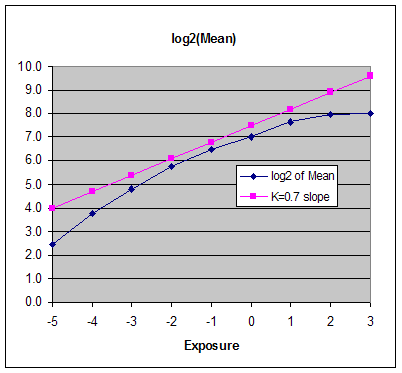
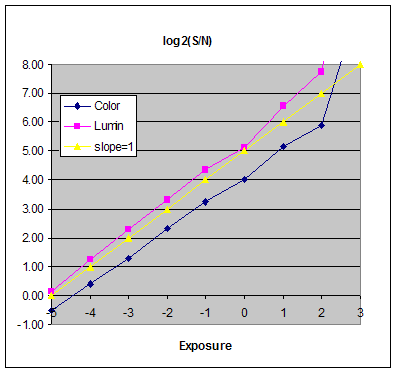
The graphs of Mean and Std. Dev. give a first impression of their dependency upon exposure. The Mean does not change linearly with exposure, but the horizontal axis is exponential while the vertical axis of the graph is linear. Saturation of the sensor is indicated by a value of 255. At exposure step +3 above normal the Std. Dev. goes to zero due to saturation and voltage clipping. The output color turns to white. .Towards very low exposure (-5) the noise decreases also because more of it just turns to black.
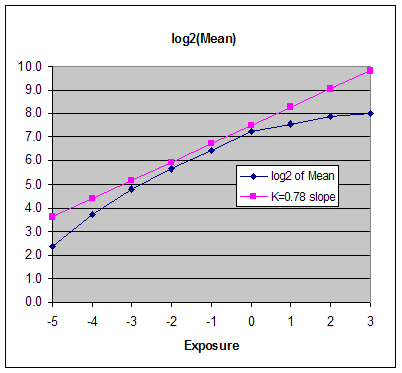
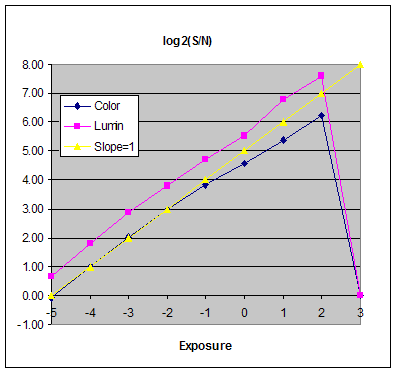
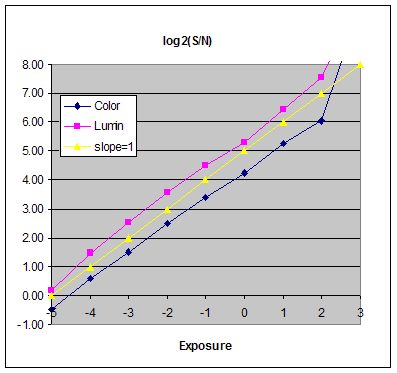
It becomes more informative when the vertical scale is in exponential units like the horizontal scale. Then 256 becomes 28 and the tick mark is 8. Therefore tick mark 2 corresponds to 22 = 4. Also it is of interest to directly plot the ratio of Mean to Std. Dev. which I call the signal-to-noise ratio S/N. This is done for the four cameras under investigation. Camera testsIn the Mean graphs below, the k=0.xy slope line approximates the slope of the transfer curve around and below normal exposure at 0. Picture contrast is reduced relative to this for flatter portions of the measured curve. Contrast is increased where the curve is steeper. The slope=1 line in the S/N graphs indicates how the S/N should increase theoretically with exposure if the sensor noise is additive and not multiplicative. The S/N at exposure level 3 goes to a large value if the sensor has not yet fully saturated. The S/N goes to zero if the sensor is already saturated at level 3.
Observations:
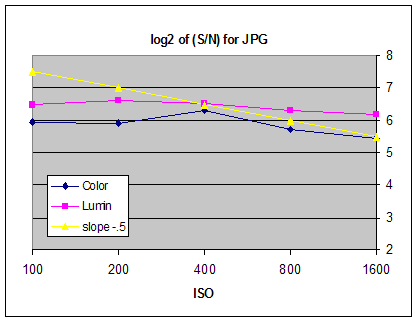
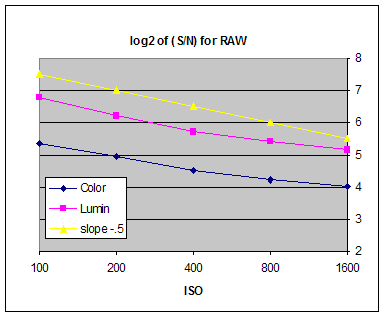
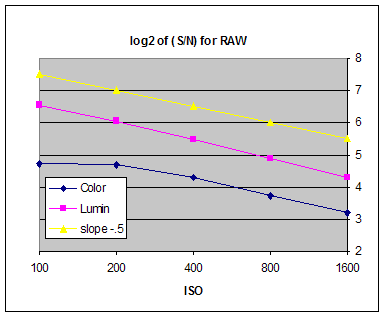
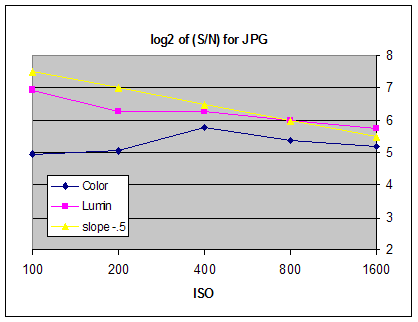
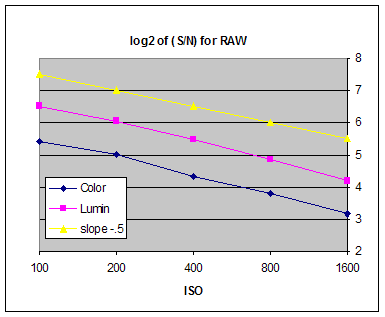
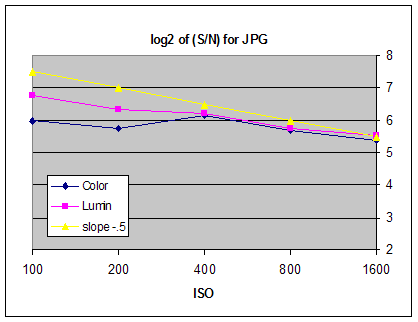
7 - ISO setting and S/NThe influence ISO setting upon the output S/N is tested for RAW and JPG files by letting the ISO selection control the number of photons that impinge upon the sensor. The light source is again adjusted for an exposure of 1/15 s at f:2.8 and ISO 400.
The resulting graphs for the four cameras are shown below. Camera testsThe line with a slope of -0.5 seems to be the rate at which the S/N would decrease theoretically with increasing ISO in RAW mode. If the measured lines do not follow this slope then it could be an indication that the RAW data from multiple pixels are post processed or that the pixel output values are no longer independent from each other. It is surprising, though, that the slope should be 1/sqrt( ISO ) when with each doubling of ISO the number of photons, which is collected by the sensor, is halved. This needs further investigation but for my camera comparison here it would not seem to matter. The S/N in JPG mode is higher than in RAW, because the noise is averaged. This means that pixel output values are smeared together. The magnitude of this changes with ISO and in all cases becomes more pronounced at ISO 400 and above. The JPG curves do not indicate how smartly the processing is done. They only show the resulting change in standard deviation.
Observations
- 15 has less color noise than 13 at ISO 100 and 200. I do not see major systematic differences between the Leica and equivalent Lumix camera models as function of ISO setting and JPG processing. All Picture Adjustments in the four cameras had been set to STD. The measured and calculated data can be found in the S-N-tests1.xls spreadsheet. For a summary see the Lumix & Leica page.
8 - General applicability of the S/N testsThe measurement of the light input to pixel output transfer function and its signal-to-noise ratio versus exposure level is easily performed with just a few tools like an ExpoDisc, lens adapters and photo processing software. So is the measurement of S/N for RAW and JPG modes. The test procedure is simple and can be readily duplicated. This opens up the possibility of collecting data for a large variety of cameras that could be posted on the Internet. The data could serve as a basis for comparison and possibly camera selection. I am not about to start something like this, though I would be interested in seeing the results for any follow up models to the Leica and Lumix models that I tested.
-- Introduction -- Lens & image -- A/D conversion -- Lumix & Leica -- Sharpness -- CCD noise1 -- CCD noise2 -- 5 years later --
|
|
| ||||